Comfort Food
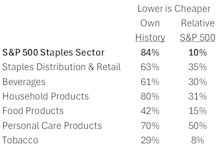
Our March report titled Lifeboat Drill examined the effectiveness of sectors, styles, and factors in protecting investors during major market declines. We found that Consumer Staples are significant and consistent outperformers during times of distress, serving as “comfort food” for investors trying to minimize their financial and emotional distress in a falling market. Staples are relatively inexpensive today based on market-relative metrics, and today’s level of cheapness has historically corresponded to positive relative returns going forward.
.png?fit=fillmax&w=350&bg=FFFFFF)
.png?fit=fillmax&w=350&bg=FFFFFF)
CPI readings were a touch above estimates again in March. The actual data surprises are not nearly as dramatic as the market reactions, which have been almost entirely driven by sentiment swings.
Read more

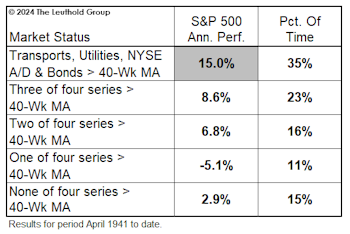
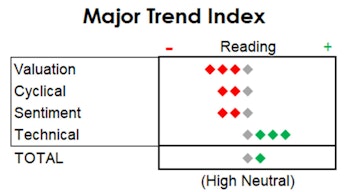
The market upswing is now confirmed by Cyclicals, Defensives, Breadth, and Bonds. Endorsement by all four occurs about one-third of the time and has led to an S&P 500 average annualized compound return of +15%.
Read more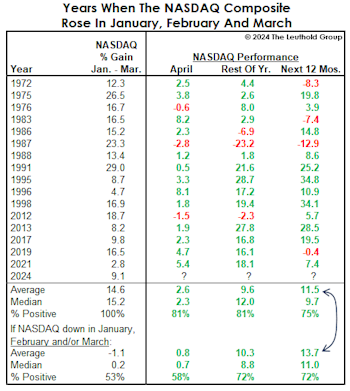
Realizing a gain in each of the first three months of the year, like Q124, is not as bullish for the next twelve months as are back-to-back gains in January and February. The three-month streak produces a one-year performance advantage of around 2%, while a string of Jan-Feb gains was additive by 900 bps.
Read more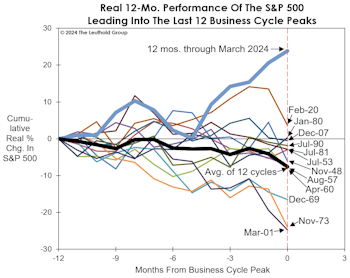
Rallies of this magnitude (+30% in 5-6 months) are not uncommon; however, this one began one year into a yield-curve-inversion cycle and with stock valuations already elevated. The latter condition could be viewed as a positive because the market surge has created one of the most pronounced short-term wealth effects in history.
Read more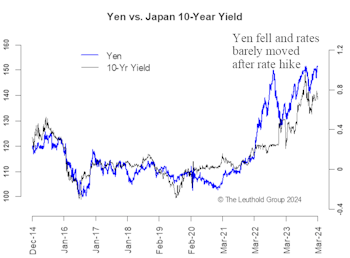
To gauge how much faith we should have in this “virtuous” cycle, we examine the macro context in terms of the business cycle, the Yen, interest rates, and inflation. Ultimately, inflation holds the key to bond yields, as the main difference between pre- and post-1990 rate hikes boils down to inflation—which is also the key determinant of how far the BoJ can go in this tightening cycle.
Read more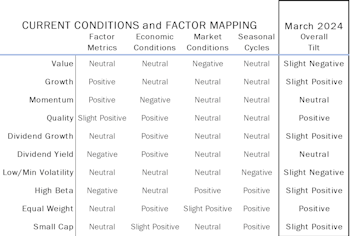
This month’s Leuthold Refresh is a quarterly update on our factor regime analysis. Factors, or investment styles, have historically performed quite differently under various economic and market conditions, and we’ve mapped these relationships to identify the factors best positioned for the environment at this time.
Read more.png?fit=fillmax&w=350&bg=FFFFFF)
.png?fit=fillmax&w=350&bg=FFFFFF)
ETFs that focus on a single sector, style, or theme enable investors to make tactical calls that reflect their outlook and risk tolerance, resetting their risk/return profile to benefit from prevailing economic and market conditions. As fate would have it, the explosion of tactical, thematic funds that began 15 years ago coincided with a drought in market cycles. Following the Global Financial Crisis, the S&P 500 only experienced one moderate drawdown in the next nine years, meaning that opportunities to judge these new thematic ETFs during market declines were in short supply. This dearth of real-world corroboration has been remedied in recent years as the market experienced three major declines in the span of 49 months, and this expanded sample size serves as the basis for our current study evaluating defensive ETFs in down markets.
Read more

.png?fit=fillmax&w=350&bg=FFFFFF)
Like January, February’s CPI figures were hotter than expected. Stickier inflation data, spiking breakeven rates, and fewer Fed cuts haven’t scared the equity market one bit.
Read more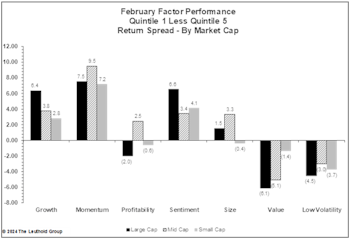
Factor performance was decidedly risk-on in February. Through month end, high-momentum names have outperformed the universe by 6.7%—we have to go back to the Tech Bubble to find a year when momentum had a stronger start.
Read more
Improvement in bank lending trends should be a tailwind for economic activity, while steeper yield curves also imply a looser lending environment lies ahead. Another area supporting U.S. economic resilience is the wealth effect: The surging wealth effect is boosting consumer confidence which, in turn, leads to higher consumption.
Read more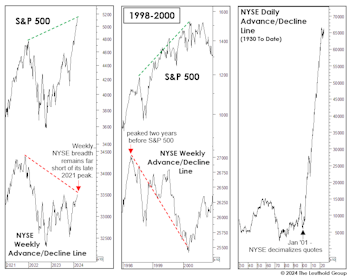
It’s been 26 months since the all-time peaks the NYSE Weekly and Daily Advance/Declines Lines. The weakness in the Daily version is especially troublesome given the strong upward bias it’s exhbited since 2001. In addition, figures for 52-Wk. New Highs and New Lows have been anemic relative to the major index gains—especially among NASDAQ stocks.
Read more
Breadth and leadership of this bull market have fallen short of the typical patterns of early-cycle bulls, even if contrasted only to other new bulls that did not emerge from recessionary lows, like 1962-66 and 1987-90. Still, participation looks broad enough that the odds are against an imminent cyclical peak.
Read more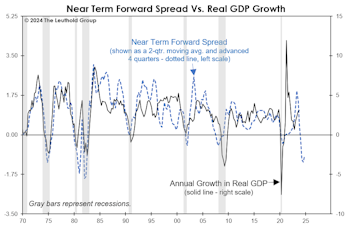
Mentions of the yield curve by the financial media and market pundits have plummeted the last few months. That’s understandable, but dangerous. We remember the same happening in 2007—with one of the more memorable dismissals coming from Fed Chair Bernanke.
Read more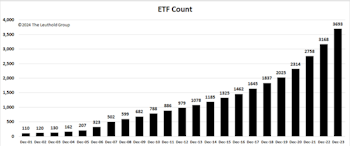
We are curious if factor ETFs have provided downside protection in recent years’ selloffs or whether their defensive nature, shown by academic studies, is lost in the translation to live-money portfolios.
Read more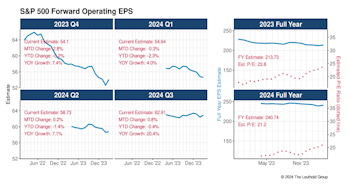
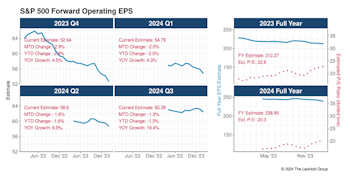
On its face, the second month of Q4 reporting was much more positive than the first. After sagging in January, the S&P 500 bottom-up EPS estimate rose back to $54—almost exactly where it stood before Q4 announcements got underway (Chart 1). With just a few stragglers left to report, full-year 2023 EPS will come in at $214. That’s almost 9% better than 2022’s final result.
Read more
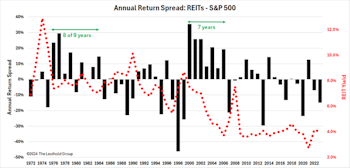
Real Estate was the top performing sector in the final quarter of 2023, climbing an impressive 18.8% against the market’s 11.7% gain. Signs of enthusiasm for the REIT industry have been rare in recent times. While the S&P 500 gained 96% over the last five years, REITs returned a paltry 31% over that time. We wondered if last quarter’s success signaled that it was time to take a fresh look at the group. This report examines the investment merits of REITs as an asset class, using the mental model of evaluating “what you pay vs. what you get.”
Read more.png?fit=fillmax&w=350&bg=FFFFFF)
.png?fit=fillmax&w=350&bg=FFFFFF)
CPI readings were a tad hotter than estimates again in January. Given the speed of disinflation that’s currently priced in by the market, we are probably headed toward a period of expectation adjustment.
Read more
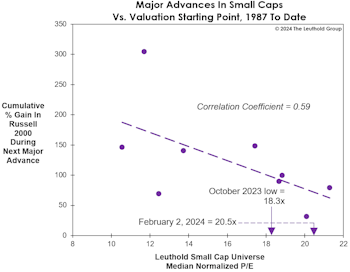
It’s too soon to know if the October low for small caps will stand, but it would have been a better, more buyable low if it had been accompanied by a recession. It’s all about “initial conditions.” Russell 2000 lows associated with recessions bottomed with a normalized P/E multiple nearly five points below that of the median multiple for non-recessionary lows—and subsequently gained an average of 185% versus +75%.
Read moreThe stock market remains “externally” strong, with the S&P 500 and DJIA at new all-time highs on February 2nd. However, the YTD performance gap between the S&P 500 and the Russell 2000 is already 8%—the worst five-week start ever for Small Caps on a relative basis. And, on a trailing 12-month basis, the percentage of S&P 500 stocks outperforming the index, itself, is the lowest on record at just 25.6%. That’s made it a challenging time for active managers and dart-throwers alike.
Read more
The probability of a soft landing has materially increased, while stronger than expected growth is likely to put a floor on inflation, which challenges the consensus disinflation view. A refresh of our Dollar Monitor suggests a weaker dollar going forward.
Read more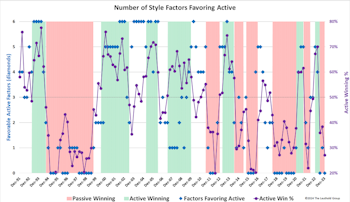
While mid- and small caps notably underperformed, large growth results were freakish. Measured against the S&P 500 Growth index, an implausible 96% of active large growth funds beat that benchmark—a result that stands as one of the most extreme win rates ever seen for a style box.
Read more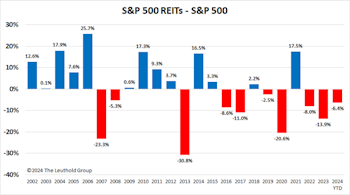
Since the pandemic, investors have been leery of adding REITs to their asset mix due to fears that flexible scheduling and work-from-home will permanently diminish the demand for office space. While that view may prove correct, the magnitude of such a change is much less significant than some might suspect.
Read more
Well, it’s Groundhog’s Day Earnings Season… again. With the first month of results for Q4, operating earnings estimates for the S&P 500 continued their long slide from their optimistic highs set back in June of 2022 (Chart 1). The 20% drop in projected EPS didn’t stop the index from rallying +30% over those 19 months. Full-year 2023 operating EPS is now crystallizing around $210—a 7% gain from 2022’s results.
.png?fit=fillmax&w=350&bg=FFFFFF)
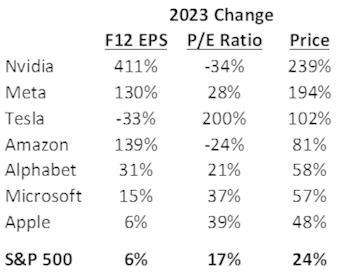
The Magnificent Seven’s remarkable performance defines the stock market in 2023. This basket of the seven largest companies in the S&P 500 index gained an average of 111% vs. an average gain of 9% for the other 493 companies. The combined impact of huge index weights and outsized performance made 2023 one of the most top-heavy markets in history. Whenever assets outperform to this degree over just a few quarters, the valuation alarm bells start clanging. Could the fundamentals possibly justify such a massive advance, or is AI mania responsible for the outperformance?
Read more.png?fit=fillmax&w=350&bg=FFFFFF)
.png?fit=fillmax&w=350&bg=FFFFFF)
CPI readings for December were a tad hotter than estimates. The path forward is unlikely to be a straight line down. Watch geopolitics closely, as it could drive prices in either direction very quickly.
Read more.png?fit=fillmax&w=350&bg=FFFFFF)
current issue