Mergers/Acquisitions
Too Many Clocks
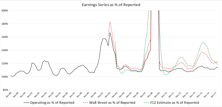
Whatever one’s philosophical leaning, the practice of adjusting earnings has left investors with too many watches to consult. We look deeper into the topic of adjusted earnings to gauge the slippage between commonly-referenced earnings clocks.
Deal Flow On The Comeback Trail
Offerings are beginning to pick up. While not even near the levels of excess, the trend bears watching. The initial surge in offerings is typically indicative of a rising market.
Market Liquidity: Down But Not Out
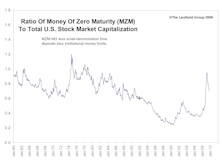
What will be one of the key performance drivers for the second half of the bull market? The short answer is the same catalyst that brought the stock market down during the latter half of the last bear market: Liquidity.
Rebounding M&A Activity
Today’s takeovers appear to make better strategic sense, and are coming at the hands of companies with good credit ratings, strong balance sheets, and good cash positions. This month’s “Of Special Interest” looks at the possibility that a rebound in M&A activity could heal an ailing stock market.
The Evaporation Of Deal Flow
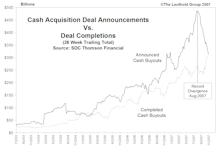
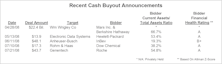
Golden Age Ends For Cash Buyouts, But Does A Silver Age Loom?
The Double Edged Sword Of Confidence & Liquidity
Cash takeovers (including private equity buyouts) provided a very conducive environment for the stock market to rise, but there are now signs that this era of endless cheap money available to corporate and private equity buyers could be coming to an end.
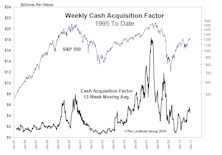
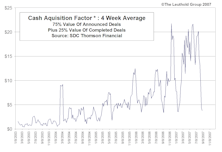
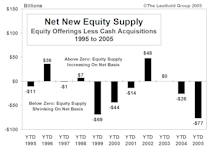
Cash Acquisitions And Their Effect On Equity Supply
Cash acquisitions shrinking U.S. equity share base.
Cash Acquisitions...Shrinking The Float Of The U.S. Stock Market At A Record Rate
The key to the 2006 Supply/Demand factors has been the huge level of Cash Acquisitions this year. Current levels smash prior 2005 record level. This bullish trend could continue to support a rising stock market.
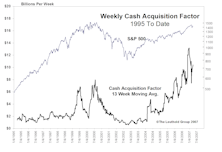
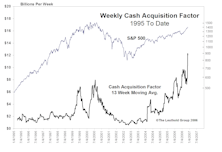
Tracking The Herd Mentality Of Corporate Buyers…..A New Indicator
In recent years cash acquisition activity has run highest when stock prices are high, and lowest when stock prices are down.
Stock Market Supply/Demand: The Four Most Interesting Trends Of 2005
In reviewing the numerous Supply/Demand factors we track, there were four trends that are perhaps the most important and/or most interesting on this front so far in 2005.
Examining Trends In Mergers & Acquisitions

Heading into 2005, many investors were looking for a pickup in M&A activity.
Goodwill Hunting…..When Goodwill Turns Bad

AOL write down of goodwill will create the widest difference between reported and operating earnings ever.
The Big Shrink…Cash Acquisitions Activity Heats Up In January
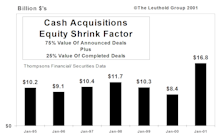
In 2000, cash acquisitions of public companies reduced the U.S. equity base at a far greater magnitude than ever before. Now it looks as though this trend is continuing this year.
The Big Shrink…Record Level Cash Acquisitions In 2000
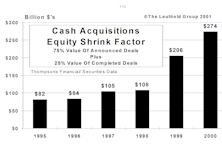
In 2000, cash acquisitions of public companies reduced the U.S. equity base at a far greater magnitude than ever before.
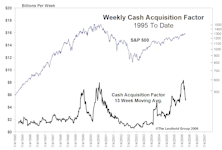
Cash Acquisitions
YTD cash acquisitions of $32.3 billion reduces YTD offerings of $49 billion to produce net equity supply of $16.7 billion for the year.
Internet Insanity Index
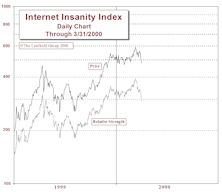
After yet another volatile month, the Leuthold Internet Insanity Index gained over 12% during February.
Cash Acquisitions
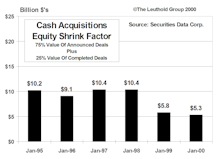
January cash acquisition activity was relatively quiet, at its lowest level in six years.
The Big Shrink…Cash Mergers Slowing, But Still Growing

Through September, there have been $172 billion of cash acquisitions. This is an all-time record, over 59% more than the previous annual record of $108 billion in 1998.
The Big Shrink…Cash Mergers Frenzy Continues
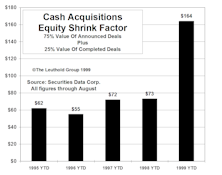
Through August, there has been $164 billion of cash acquisitions. This is an all-time record, over 52% more than the previous annual record of $108 billion in 1998.
The Big Shrink…Cash Mergers Slowing In July, But YTD At An All-Time Record

Through July, there has been $146 billion of cash acquisitions. This is an all-time record, over 35% more than the previous annual record of $108 billion in 1998.
The Big Shrink

Cash acquisitions are shrinking U.S. equity base at a faster pace than ever before…$135 billion in the first half of 1999, a record so far, with no signs of a slowdown.
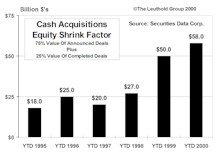
The Big Shrink

1999 YTD cash acquisition factor nearly $100 billion, far exceeding YTD totals for the last four years.
The Big Shrink

1999 YTD cash acquisition factor nearly $82 billion, over 2 ½ times totals for the last four years.
Cashing In On Strong Balance Sheets: The Net Net Working Capital Screen

This month we are activating the “Net Net Working Capital” (NNWC) screen as an active part of the Equity Portfolio. NNWC is a modified working capital analysis which, in some cases, is useful in making preliminary, liquidity based company valuations.
Will Saudi Arabia Tender for Exxon? ...(Or Is the Party Over?)

The mega merger mania may be about over. Our model scored big with Getty and now Gulf. We cashed in half of the 4% Gulf position at 69 on January 29 and have just sold the rest at 71. $80? Well maybe, but why be greedy? The party may be about over.
Perception for the Professional
March 2026 Issue

Featured Articles
Sector Navigator
March 2026 Issue
