Estimating The Downside
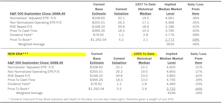
Estimating the Downside - July 2026

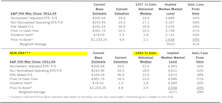
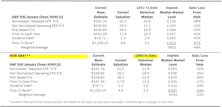
The S&P 500’s sharp Q2 rally ended with a whimper, as the index shed 1% in June. Still, since the end of March, the 15% gain translates to the S&P 500’s best quarter since Q2-2020. From here, the index would lose 44% if it moved back to its median level based on data from 1957 forward.
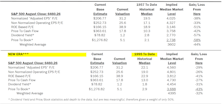
Estimating the Downside - June 2026

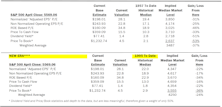
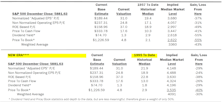
The rally in the S&P 500 continued through May, ending the month with nine consecutive weekly advances. The index has now advanced 19% since March 30th.
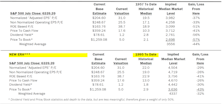
Estimating the Downside - May 2026

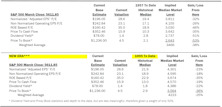
The S&P 500 rocketed higher in April, posting its first double-digit monthly gain since November 2020. Based on data from 1957 to date, downside to median levels is now -44%.
Estimating The Downside For The S&P 500

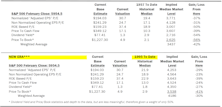
The index had its worst month since the tariff tantrum one year ago. Yet, a sharp rally on the last trading day took some of the sting out of the March loss; downside estimates narrowed by a similar amount.
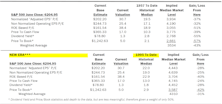
Esitmating the Downside - March 2026

On a total return basis, the S&P 500 posted its first monthly loss since last April. Downside to median levels narrowed slightly but remain very close to contemporary extremes.
Estimating the Downside - February 2026

Advances in the S&P 500’s underlying fundamentals marginally outpaced the improvement in price. Our “New-Era” downside-to-median estimate narrowed from -32% to -30%, while the 1957 to date figure was unchanged month-over-month.
Estimating the Downside - January 2026

After narrowly averting a bear market in April, the S&P 500 rocketed 39% to end the year with an +18% total return. At present, our data shows the potential downside to revert to median levels is a loss of 44%.
Estimating the Downside - December 2025

The index gained 5% in the last five trading days of November to eke out a minuscule gain—but it was enough to score its seventh-consecutive monthly advance. The S&P 500 is back within spitting distance of its all-time high set in late October.
Estimating the Downside - November 2025

At the market trough back on April 8th, using history from 1995 forward, our downside-to-median calculation showed a potential loss of 13% for the S&P 500. Today, that risk measure sits at -34%, a contemporary extreme.
Estimating the Downside - October 2025
Make that “five” consecutive-monthly advances for the S&P 500. From the April 8th low through the end of September, the index has returned an eyepopping +35%.
Estimating the Downside - September 2025
The S&P 500 notched its fourth consecutive monthly gain through August, advancing 2%. Over that span, our downside estimate for the index to return to its historical median level (1995-forward) widened from -24% to -32%.
Estimating the Downside - August 2025
The S&P 500’s potential downside to its 1957-to-date median is -44%, and its normalized P/E ratio of over 30x continues to be a concern. However, we can only cry “wolf” so many times… 11 of the past 14 month-end measures have been above that threshold.
Estimating the Downside - July 2025
The S&P 500 continued its surge following the tariff scare—up 25% from the close on April 8th through the end of June. Based on history from 1957 to date, the index’s potential downside to median levels has deepened to -43% (vs. -41% as of May 31st).
Estimating the Downside - June 2025
The S&P 500 is back within spitting distance of its all-time high, and, as one would guess, our downside calculations are stretched almost to their contemporary extremes.
Estimating the Downside - May 2025
A wild April ended almost exactly where it started for the S&P 500, leaving our downside estimates pretty much unchanged. A decline to median levels (1957-date) would put the S&P 500 at 3,487 (a 37% loss).
Estimating the Downside - April 2025
The S&P 500’s March loss was its worst since December 2022. The Q1 decline broke the index’s streak of five consecutive quarterly advances. Still, downside to median levels remains substantial: -38% based on 1957-to-date history; -25% using data from 1995-present.
Estimating The Downside - March 2025
To return to median valuation levels, the S&P 500 would need to decline 42% (based on 1957-to-date historical figures).
Estimating the Downside - February 2025
Our Normalized S&P 500 P/E multiple (31.5x) ended January just below the contemporary high-water mark of 32.2x set at the end of November. This is the eighth consecutive month the ratio has been north of 30x—the threshold associated with previous market bubbles.
Estimating the Downside - January 2025
The S&P 500 lost 2.5% in December but fared far better than both Mid- and Small-Cap Indexes (S&P 400 -7.3%; S&P 600 -8.1%). From today’s level, the S&P 500’s potential downside to its 1957-forward median is -43%.
Estimating the Downside - December 2024

The S&P 500 returned to its winning ways in November, logging its largest monthly advance (+5.7%) in a year; over the last 13 months, the index has a price gain of 44%.
Perception for the Professional
July 2026 Issue

Featured Articles
Sector Navigator
July 2026 Issue
