The Leuthold Refresh ...Revisiting a research study of ongoing interest
Active/Passive Update Q4-2025
Financial markets mimicked Mother Nature in the fourth quarter, drifting into a kind of hibernation. Style returns were rangebound around zero, and the spread between returns was about as narrow as we can recall. Active portfolio performance shows there wasn’t much to pick from to add significant value.
Factor Tilt Update
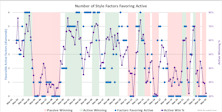
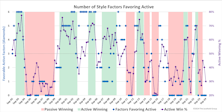
The humdrum fourth quarter was not enough to derail the full year’s storyline, which goes into the books as a clean sweep for aggressive, bullish investment factors.
S&P 500 Earnings Waterfall 3Q 2025
The third quarter of 2025 produced the strongest earnings results in recent memory, paced by revenue gains in all eleven S&P 500 sectors. Sales registered 8.7% growth over 3Q24, leading to improvements in profit margins across the income statement.
Active/Passive Update Q3-2025
Q3 was characterized by two traits that typically favor a passive investment process while creating a drag for active portfolios: Convincing leadership of growth stocks and high absolute returns.
Factor Tilt Update: Quality Swoons
In contrast to its solid showing through the mega-cap-growth boom of recent years, Quality was a Q3 outlier, trailing SPX by over 5%. Part of the cause is sector allocation, as defensive stocks are badly out of favor. The other force was stock selection—for example, the absence of NVDA.
S&P 500 Earnings Waterfall 2Q 2025
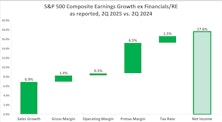
The second quarter of 2025 posted another “all green” earnings waterfall, as each component of our profit breakdown gained ground. Sales growth was a robust 6.9%, paving the way to a 17.6% gain in net income for S&P 500 members
Active/Passive Update Q2-2025
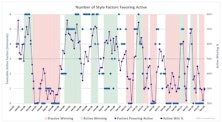
Our hypothesis is that true active managers are more diversified than their style box indices and when one style has a prodigious quarter, active portfolios of that variety will surely lag. Q2’s low success rate for actively-managed growth portfolios is exactly what we expect in such a stylistically lopsided period.
Factor Tilt Update
The risk-on rally since April produced a complete flip in factor performance vs. Q1. The year began with Low Volatility and Dividend factors leading the pack, posting positive returns even as the S&P 500 lost 4%. Q2 performance has High Beta, Momentum, and Growth far outpacing SPX’s nearly 11% gain.
S&P 500 Earnings Waterfall 1Q 2025
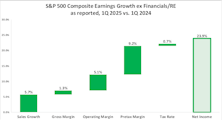
Net income soared almost 24%, with each step in our earnings growth waterfall registering in the green. Pretax margin expansion contributed 9.2%; however, this last step of the waterfall is always influenced by unusual items—and Q1 saw an abnormally positive impact from lower write-offs.
Active/Passive Update Q1-2025
Our research shows that weaker equity markets are favorable for active managers, and this quarter’s overall success rate of 57% is consistent with that expectation. Active managers outperformed in six of nine style boxes, led by an excellent 82% win rate for small-blend managers and a 74% success rate in large value.
Factor Tilt Update
S&P 500 performance turned negative in the first quarter of 2025 and factor returns responded as expected. Defensive factors including Low Volatility and dividend-focused styles produced positive returns, and Value managed to eke out a tiny gain.
S&P 500 Earnings Waterfall 4Q24
The index’s income statement turned in one of its best showings of recent years. Year-over-year sales growth for S&P 500 companies landed at 5.6%, exceeding the 5.0% rate in nominal GDP and mimicking the sales growth posted earlier in the year.
Active/Passive Update Q4-2024
The year 2024 will go down as one of the most hostile environments for active investors in the last 30 years. Style, size, and absolute market returns all have an impact on the relative performance of active versus passive portfolios; the fourth quarter continued a trend that has been in place for over two years.
Factor Tilt Update
Our previous update reported that eight of ten factors outperformed the S&P 500, leading us to hope that maybe, just maybe, the market was broadening out from its narrow focus on mega-cap growth. Those hopes were dashed in the fourth quarter, as only two of ten factors managed to outperform the index.
S&P 500 Earnings Waterfall 3Q24
Revenues progressed for 75% of S&P 500 companies reporting, but only 60% of those realized gains in operating income. Pretax and net income continued to drop, such that headway in the bottom-line was positive for barely more than half of the firms.
Active/Passive Update Q3-2024: The “Other 493” Come Alive
Despite outperformance of value and small-cap stocks, actively-managed value and small-cap portfolios both struggled. No style box managed a clear win in favor of active management, which is unusual for such leadership conditions. There are several explanations that can account for this behavior.
Factor Tilt Update
Factor returns flipped dramatically in the third quarter after posting widely divergent results in the first half of 2024. The opening six months of the year saw Momentum and Growth each gain more than 20%, while the combined factors’ overall median return was a measly +5%.
S&P 500 Earnings Waterfall 2Q24
Continuing strong GDP growth enabled S&P 500 member companies to post solid year-over-year results in the second quarter of 2024.
Extreme Outcomes Beginning To Moderate
Domestic equities lost a little over 3% in the second quarter. Seven styles posted declines in that range, only to be countered by the continued outperformance of mega-cap growth stocks, which gained almost 10% for the quarter. This odd mix of returns left the S&P 500 up 4.3%, although that was clearly not the central tendency of equities in 2Q24
Factor Tilt Update
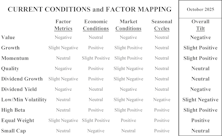
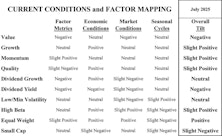
This month’s “Refresh” is the quarterly update on our factor regime analysis. Factors, or investment styles, have historically performed quite differently under various economic and market conditions, and we have mapped these relationships to identify which factors are best positioned for today’s environment. Second quarter factor returns continued the hot-and-cold pattern that has defined equity markets for some time now.


