Chart Of The Week
Did You Miss Meme?

And just like that, we’re thrust back into the good ‘ole days where Roaring Kitty was a household name and SwaggyStocks.com was one of our bookmarks in Internet Explorer (RIP). Highly-shorted stocks are back in vogue among the retail crowd. Those virtuous crusaders—or perhaps compulsive gamblers—brave or stupid enough to crowd into names with almost 50% of shares sold short have returned for another round of “sticking it” to the short-sellers*.
Are The Trump Trades Working Out?
.png?fit=fillmax&w=222&bg=FFFFFF)
It depends on who you ask. Non-equity investors might think the Trump trades are playing out just like in 2016. Over the last few months, FX traders and bond investors could have followed the 2016 script and made out like bandits (Charts 1 & 2). However, at this juncture, it might be time to at least take some chips off the table—if the 2016 analog stays intact, both the U.S. dollar and interest rates are poised to change course over the next few months. Near-term knee-jerk reactions aside (stronger dollar, lower yields), the newly announced tariffs will likely impact growth more than anything else, which would make it hard to sustain a stronger dollar and higher rates.
4% Club Getting Crowded
.png?fit=fillmax&w=222&bg=FFFFFF)
New Years Eve 2024 was a party to remember for the 4% Club (stocks with a minimum 4% weight in the S&P 500). Thanks to December’s ridiculously top-heavy performance, a record five firms toasted the new year in the VIP-only Club (Chart 1). For most of the past five years, membership had been limited to two or three companies. Before that, the Club’s March 2000 high-water mark of three firms seemed unobtainable—and, with a little hindsight, a laughable signpost of the Tech Bubble. Well, who’s laughing now?
The Russell 2000 & AANA
.png?fit=fillmax&w=222&bg=FFFFFF)
The most notable gainer in last week’s Trump Bump 2.0 was the Russell 2000. That index’s weekly surge of +8.6% was its best since the wild pandemic gyrations of April 2020. Yet, this latest Trump-associated upswing fell short of the Russell 2000’s election-week return of +10.2% in 2016 when Trump was the clear underdog.
Smaller Looks Better (If You Can Look Away From The Tape)
.png?fit=fillmax&w=222&bg=FFFFFF)
It’s been awhile since readers have looked to The Leuthold Group for a rosier take on the stock market than what they can get from Wall Street. But there’s a time and place for everything.
Some were unnerved this week to hear the usually cheery strategist of a major U.S. investment bank predict S&P 500 total returns for the next decade of just +3% per year. While depressing, our work does not find that forecast out of line. We estimate that if S&P 500 5-Yr. Normalized EPS grow at their 1957-to-date annualized rate of +6.3% for the next ten years, and the P/E multiple on those future EPS were to revert to its median level for the same time period (19.4x versus today’s 31.6x), the S&P 500’s annualized total return out to late 2034 would be +2.6%.
Market Momentum & The Economy

We take a historical look at potential implications of the market’s strong upside momentum for both the stock market and the economy.
One-Year Off The Low: A Muted Celebration

The bear-market low in the S&P 500 occurred one-year ago, yesterday. Whether that low remains intact during a potential recessionary down-leg is difficult to say, but the mere fact it’s survived for an entire year renders it significant.
Market Odds For The Second Half
.jpg?fit=fillmax&w=222&bg=FFFFFF)
With the halfway point of 2023 two weeks away, the S&P 500 has broken out to a 12-month high. The index has accomplished that feat 32 times during the month of June—or exactly one-third of all cases measured back to 1928.
What Is Narrower Than “Narrow”
.jpg?fit=fillmax&w=222&bg=FFFFFF)
The May Green Book, published a short three weeks ago, included an article titled “Market Narrowness in 2023” discussing the Big Tech theme’s market leadership this year. We noted that 77% of the S&P 500’s year-to-date return through April 30th was produced by the nine S&P 500 members of the NYSE FANG+® Index, itself a collection of just ten large companies that dominate the Social/Cloud/Innovators cohort. (As for which FANG+ company is not also in the S&P 500, that is your puzzle challenge for this long weekend.)
Checking In On The Rally At The Six-Month Point
.jpg?fit=fillmax&w=222&bg=FFFFFF)
Yesterday was the six-month anniversary of the bear market low of 3,577.03 in the S&P 500. We think it’s unlikely the moderate upswing since then represents a new cyclical bull market. However, with the evidence still weighing in at Neutral, we’re not betting the farm on that opinion.
What Does The Dow Have To Say About A “New Bull?”
.jpg?fit=fillmax&w=222&bg=FFFFFF)
Yesterday the NASDAQ 100 closed up more than 20% from its late-December low, prompting the media to enthuse that it had entered a “new bull market!” Sadly, though, the “NDX” has no company among the broad indexes: During this NASDAQ move, gains in the S&P 500 and Russell 2000 have been just 6.5% and 2.9%, respectively, while the DJIA is down 0.5%. (So much for January’s “breadth thrust!”)
Small Caps: We’ve Seen This Setup B-Four
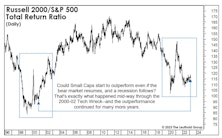
In mid-2020, we wrote that a new multi-year leadership cycle had probably begun. Technically, that belief hasn’t been disproven, but the extent of outperformance has been disappointing in the nearly three years since.
The Job Market Just Rescinded A Recession Signal
.jpg?fit=fillmax&w=222&bg=FFFFFF)
For those disappointed that February’s employment report won’t be released until March 10th, we have something to consider in the meantime.
Fair Winds For Active Managers
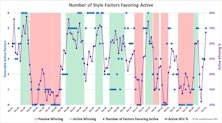
The defining characteristic of last year’s bear market was the collapsing valuations of speculative growth stocks. A mania for themes such as cloud computing and disruptive innovation during 2016-2021 drove those names to fantastical valuations and bestowed market capitalizations of tens- and even hundreds of billions of dollars on such companies, many of which had yet to turn a profit.
Is This Year’s Strong Start “Signal Or Noise?”
.jpg?fit=fillmax&w=222&bg=FFFFFF)
This year is off to a much stronger start than suggested by the 3-4% gains in the blue-chip averages: Through January 12th, the Value Line Arithmetic Composite—an equally-weighted index of about 1,700 stocks, was up 7.0%.
Confidence & Causality
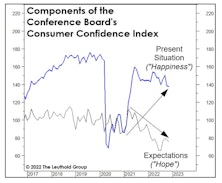
It will be years before policymakers know the long-term effects of the COVID experiment with Modern Monetary Theory. However, the episode has helped answer, once and for all, a question that’s troubled psychologists forever: Money can buy happiness! But it can’t buy hope.
Jay Powell, The Chartist
.jpg?fit=fillmax&w=222&bg=FFFFFF)
When Jerome Powell took the reins of the Federal Reserve in early 2018, many commentators cheered the fact that he does not possess a Ph.D. in Economics. It will be many, many years before historians are able to conclude whether that’s a good or bad thing.
Yesterday’s action, though, left us wondering whether Powell might stealthily be in the process of earning a different designation—that of Chartered Market Technician (CMT).
How This Year’s Inflation Peak Differs From Its Predecessors
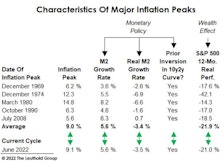
Our studies of economic and stock market history are meant to provide perspective, not an investment roadmap. But occasionally a current trend will resemble the past so closely it’s eerie.
Take the current inflation cycle. If (as we believe) June’s CPI inflation rate of 9.1% represents the peak for this business cycle, then many of its characteristics have lined up almost perfectly with the “average” of past inflationary episodes.
Interrupting The Recession Debate With A Reminder Of How Hot The Economy Is
.jpg?fit=fillmax&w=222&bg=FFFFFF)
“Money illusion” continues to complicate analysis of the economy and financial markets. It might be a time when age and experience will actually prove helpful: Only investors who are 65 or older have experienced gaps between “nominal” and “real” data as wide as today’s.
Time To Retire The Fed Model?
.jpg?fit=fillmax&w=222&bg=FFFFFF)
We’ve heard no references lately to the famous “Fed Model” for stock market valuation. We think we know why: The model’s usual proponents probably don’t like its current verdict—which is that stocks are far more expensive than at the early January market peak.
Perception for the Professional
July 2026 Issue

Featured Articles
Sector Navigator
July 2026 Issue
