Earnings Almanac
Q4: Double Beats Moderate
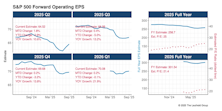
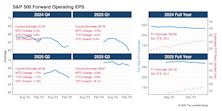
After the first month of Q4 reporting, S&P 500 estimated bottom-up operating EPS are now 4.5% higher than at the end of December. This bounce follows the initial script of the previous two quarters, which saw projections jump 2% July and 5% in October. Final figures for both Q2 and Q3 continued to climb as reporting progressed, so we’d presume Q4 to follow suit, increasing somewhat more before earnings season is finished. Also, Q4 has now finally shot above its pre-“Liberation Day” estimate set back in March.
Q3 EPS Gusher
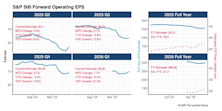
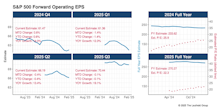
With the second month of Q3 reporting complete, S&P 500 estimated bottom-up operating EPS continued to scream higher (Chart 1). At $72.40, it is now 8.2% above the level at the end of September (before Q3 earnings reports began). Percentage-wise, this is double the bounce we saw two months into the still historically very good Q2 earnings period. Q3’s YOY growth stands at 22%—the highest rate since the 2021 surge out of the pandemic.
Spiking Q3 EPS
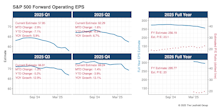
S&P 500 Q3 estimated bottom-up operating EPS shot 5% higher with results for the first month of reporting (Chart 1). This pop is much more impressive than the 2% gain we saw in July (after the first month of reporting for Q2). The current Q3 estimate of $70.27 is about a percent better than the last reading prior to the “Liberation Day” announcement. The tariff-induced bottom-line reckoning feared this spring has yet to materialize. We’d surmise that the still L-shaped EPS snail-trail for Q4 will bounce higher, too, come January.
Q2 Results Get More Impressive
The S&P 500’s Q2 estimated bottom-up operating EPS has now increased 4% since the start of reporting. This V-shaped recovery has erased the discount in earnings seen after “Liberation Day”; EPS estimates now stand even with those at the end of March. Despite the higher revisions for the current quarter, projections for the final two quarters of 2025 have only leveled off from their tariff-scare down-leg.
Lowered Bar Cleared Easily
The S&P 500’s Q2 estimated bottom-up operating EPS shot 2% higher after the first month of reporting. This recovery effectively negates some of the earnings markdown associated with trade uncertainty in the months leading up to this reporting season. The EPS snail trails for the coming three quarters also leveled out or have even turned higher.
Slowing Sales, Fat Margins
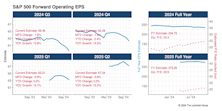
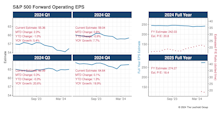
The S&P 500’s estimated bottom-up operating EPS for Q1 lost altitude during the second month of reporting. (Chart 1). That resumes the rounded downslope of estimated EPS erosion for the quarter that seems foreign (though normal) after the resiliency of the 2024 data. The next three quarters of 2025—periods that will be affected by the trade war—continued their post tariff decline. The waning projections still have the index inline for 10% YOY EPS growth. At this point in the game, 5% growth is probably a stretch.
Q1 EPS Slide Arrested
The S&P 500’s estimated bottom-up operating EPS nosed slightly higher during the first month of Q1 reporting. This is a welcome development following the steeper-than-usual decline over the past six months. Projections for the next three quarters of 2025 weren't as fortunate in April, as they all experienced a noticeably steep leg down of around 3%. The full-year 2025 operating EPS estimate for the index now sits at $260.72, down a conspicuous 4% since the beginning of the year.
Rough Reporting For The Mag Seven
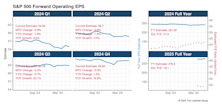
The S&P 500’s bottom-up operating EPS continued to improve in the second month of reporting. Since the start of Q4 announcements, the EPS figure has increased 1%. The direction of the estimate, not necessary the amount, is what’s impressive. The same can’t be said for the coming two quarters, however. Bottom-up projections for Q1-25 have fallen 4% in the last two months, while Q2-25 is off 2%. Again, sharp moves higher in the EPS snail trails are exceedingly rare. With almost all of the reporting done for 2024, the S&P 500’s operating EPS of $234 equates to a healthy YOY gain of 9.5%. The expectation for full-year 2025 currently stands at +14.3%.
EPS Pointing Higher
The S&P 500’s estimated bottom-up operating EPS nosed slightly higher during the first month of Q4 reporting (Chart 1). That’s a win in the usual slow-erosion, forward EPS game. The index is on track to expand operating earnings at 14% YOY for the last quarter of 2024, which would be the highest since Q2-23 (+17%) and well above the 4% average we’ve seen over the past three years. Full-year 2024 operating EPS is starting to crystalize around $233—a 9% improvement from 2023’s results. At present, EPS growth projections for 2025 are just shy of 16%.
Back To Shrinkage In Q3
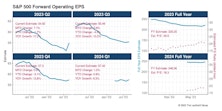
The S&P 500’s estimated bottom-up operating EPS was flat during the second month of Q3 results (Chart 1). With reporting essentially complete, the final Q3 figure will be roughly 1.5% below what was ultimately projected before the quarter’s announcements began. That’s a decent divergence from Q1 and Q2, which came in at 0.7% and 0.3% ahead of their respective “pre-reporting” estimates. The shrinkage in Q3 EPS is more in tune with long-term trends but also marks the end of a nice window of higher results—which is a rarity. Traditional EPS erosion is also evident in the snail trail for the anticipated outcome in Q4 .
Double Beats Rare In Q3
The S&P 500’s estimated bottom-up operating EPS shrank 2% during the first month of Q3 reporting (Chart 1). A similar, slightly larger drop in the EPS estimate was experienced in July, as results were tallied for Q2’s first month of reporting. That initial Q2 deficit was recouped over the next two months and actual results eventually ended higher than what was projected at the beginning of earnings season. To maintain this year’s strong earnings streak, where results match estimates (not common), we’ll need another “spring-back” scenario at the back end of Q3.
Q2 Bounce Back To Trend
The S&P 500’s estimated bottom-up operating EPS rebounded 4% to $58.48 in the second month of results (Chart 1). With Q2 reporting essentially complete, EPS is now slightly above where it stood before reporting began. After the sharp dip during the first month of Q2 earnings announcements, we’ve resumed the recent and very positive “no-erosion” trend in aggregate EPS.
Q2 Stumbling Out Of The Gates
The S&P 500’s Q2 bottom-up estimated operating EPS sank 3% to $56.38 in the first month of reporting (Chart 1). This is a notable departure from the 2% rise we saw with the first month of Q1 results. One month is certainly not a trend but the most recent data brings some question into the above-average, no-erosion EPS estimates we have grown accustom to.
EPS Estimates Holding Up Well
Q1 bottom-up operating EPS for the S&P 500 sank slightly to $54.94 after the second month of reporting. However, with reporting for the Index nearly complete, this figure is still 70 cents above the final pre-reporting estimate recorded at the end of March. The fifteen months of Q1 snail trail in Chart 1 shows remarkably consistent estimates, especially given our recent “ski slope” quarters of 2023. EPS estimates, at least in the aggregate, continue to hold up nicely for the other three quarters of 2024 reporting as well.
Sales Beats Continue To Underwhelm
Q1 bottom-up S&P 500 operating EPS estimates jumped a little over a dollar to $55.36 after the first month of reporting. This halted the usual “slow-erosion” pattern that shaved $3 off the quarter’s estimate since last summer (Chart 1). The three forward quarters of 2024 also experienced a bump in estimates. S&P 500 full-year EPS projections now sit at $242. That would be a 13% YOY gain from 2023’s results.
A Small Bump In EPS With Latest Q4 Reports
On its face, the second month of Q4 reporting was much more positive than the first. After sagging in January, the S&P 500 bottom-up EPS estimate rose back to $54—almost exactly where it stood before Q4 announcements got underway (Chart 1). With just a few stragglers left to report, full-year 2023 EPS will come in at $214. That’s almost 9% better than 2022’s final result.
Same Themes Continue In Q4
Well, it’s Groundhog’s Day Earnings Season… again. With the first month of results for Q4, operating earnings estimates for the S&P 500 continued their long slide from their optimistic highs set back in June of 2022 (Chart 1). The 20% drop in projected EPS didn’t stop the index from rallying +30% over those 19 months. Full-year 2023 operating EPS is now crystallizing around $210—a 7% gain from 2022’s results.
Disappointing On The Top Line
As we put a fork in the S&P 500’s Q3 earnings, our snail trail is now decidedly pointing south. However, the kink you see in Chart 1 should not be viewed as an EPS collapse. An accounting sleight of hand from Berkshire Hathaway—R.I.P. Charlie Munger—shaved off just under $3/share in EPS for the index. If that were added back, the quarterly estimate of $55 would be pretty much unchanged since the start of the summer.
Not A Good Time To Miss Estimates
A little over half of the S&P 500 reported earnings for calendar Q3-23 in October. Bottom-up operating EPS estimates for the quarter have remained basically flat since May. This is a positive development given the proclivity of EPS estimates to erode over time. We should note, however, that longer term, the decline in estimates for Q3 has been well above average—diminishing by 14% since April of 2022. If there will be another reporting window pop in EPS estimates for Q3 like we saw for Q1 and Q2, it will have to come in November.
Excellent Back 9 For Q2 Reporting
An outstanding second half for Q2-23 earnings pushed the S&P 500 bottom-up EPS estimate from $51.30 to $54.92. Amazon and Nvidia were the two largest contributors to the August surge. With the entire index nearly done reporting, our current EPS estimate will end 11% below its high watermark ($61.56).


