Yield Curve
Yield Curve Steepening—Stalling But Trend Intact

Given the beginning of an easing cycle in September and the Trump Trade in October, the lack of steepening in the yield curve is intriguing. While tighter financial conditions are likely a challenge to the steepening move, policy regimes and the term premium are favorable toward further curve steepening.
A Major Yield-Curve Steepening Cycle Has Started

The 10Y-2Y yield curve broke above the key level of -0.4% and that means a double-bottom pattern is in play. While we are confident that a major steepening cycle is here, we have to acknowledge that the nascent move could fail. A steepening move is also the market’s way of signaling easier conditions ahead.
Yield Curve Re-Steepening—At A Critical Crossroads

We studied market behavior around yield curve re-steepening and identified six historical cases. Of those, three were successful and preceded major recessions. The other three instances failed and reversed to new lows. The gist of the study: We are at a critical crossroads.
1966-67: When The Yield Curve “Failed”
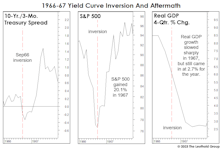
Given the tendency of economists and strategists to dismiss the message of an inverted yield curve, it’s surprising there’s been no scrutiny of the “dog that didn’t bark”—the inversion of 1966. That’s the last time an inverted curve did not lead to a recession.
The Yield Curve And The Problem Of Timing
Frequently, there’s money to be made in the stock market in the months following the initial curve inversion. After the inversions of August 2006 and June 2019, the S&P 500 rallied another 23% and 19%, respectively, into its final bull market high. If this cycle plays out in textbook fashion, the business-cycle peak would arrive in September.
A “Curve”-Ball We Didn’t See Coming...

Market veterans know there’s just one thing more probable than a recession after the yield curve inverts: Yield curve denial among a large group of sell-side economists and market strategists! Indeed, the earliest of those dismissals occurred last March—a month before the first of more than a dozen iterations of a yield curve inversion.
Which Yield Curve?
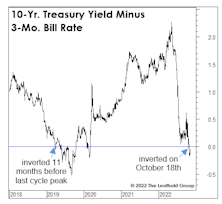
Last month’s inversion in the 10-Yr./3-Mo. Treasury spread further tilts an already lopsided scale in favor of a U.S. recession in 2023. That spread has been considered the gold standard from an economic forecasting perspective, and is the basis for the New York Fed’s Recession Probability estimate (which, by the way, should break above its critical 35% threshold when it’s published later this month.)
Six Themes Around A Full Yield-Curve Inversion

The main yield curve drivers—fiscal and monetary policies—might be suggesting a steepening move is coming soon, while bank stock performance may also be hinting at a turn in the curve. However, a durable selloff in the U.S. dollar would be needed to support a steeper yield curve, so the tightening pain could last a while longer.
Tightening Into A Slowdown: Month Eight

We think the U.S. economy will slip into recession sometime in the next year, but the level of “excess savings” provided by pandemic aid renders the already difficult task of timing more elusive than ever.
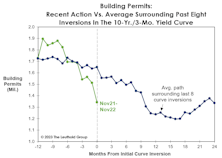
When There’s No Slack, It’s A Bad Time To Slack Off
.jpg?fit=fillmax&w=222&bg=FFFFFF)
The scene in our neighborhood in the last two summers has become one of relaxed and well-tanned professionals out in their yards overseeing home improvement and landscaping projects. No surprise: Not a single one has told us they’re less productive when working from home!
The Yield Curve: Two “Perfect Records” At Stake
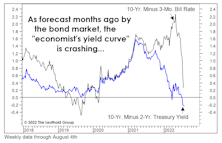
Yield curve action is getting harder to dismiss by the day. But which curve is the most relevant? We tried to answer that question in disciplined fashion in April. To our surprise, the “2s10s” spread that’s ubiquitous in bond-land scored near the bottom of the pack.
Yield Curve Inversion—Count Down To A Bull Steepener

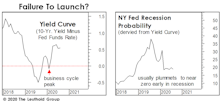
Now that the yield curve has inverted, its dynamic is apt to change from bear flattening (higher rates, flatter curves) to bull steepening (lower rates, steeper curves) fairly soon.
Looking “Bustier?”
Key indicators are indeed trending in “pre-recessionary” fashion. Among them is the ISM New Orders Index, which dipped into contraction territory in June while inventories increased. Others are the JOLTS that shows a strong (but weakening) labor market, and unemployment claims—which have ticked up.
The Terrible “Two-Year”
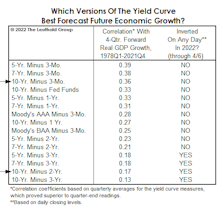
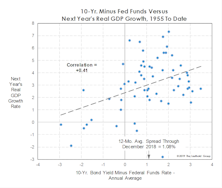
In a simple test of 15 yield-curve variants, we found that the 2s10s spread ranks second to last, based on its correlation with one-year-forward real-GDP growth since 1978. The three best measures employed the 3-month bill as the “short” rate. The spread between the 5-year note and 3-month bill showed the strongest correlation with subsequent economic growth.
Yield Curve—Focus On More Reliable Themes

Predicting a recession is a very tall task, let alone using a single yield-curve indicator with long and highly variable lead time. Instead, we would rather focus on some of the more reliable themes: The macro-policy setting; U.S. dollar; and Bank stocks.
Yield Curve Crossing The 50-Bps Rubicon—No Imminent Trouble

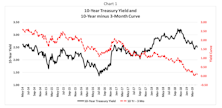
The U.S. 10/2-year curve just fell below the key threshold of 50 bps. Over the last 25 years, the yield curve proceeded to invert after this “Rubicon” was crossed. That doesn’t mean imminent trouble. The lead time of a yield-curve signal is lengthy, but it—and real yields—definitely warrant close monitoring.
Too Early For Curve Watching?

Last month, we published a table showing where we thought a variety of economic and financial-market measures lay along the economic recovery “continuum.” Although the upturn has officially entered just its 22nd month, the bulk of those measures looked “late cycle” in nature.
What “Causes” Inflation To Decline?
Last year’s consensus view that inflation would prove “transitory” missed the mark. There’s no reason for shame; inflation forecasting hadn’t been a required investment skill for the previous 30 years.
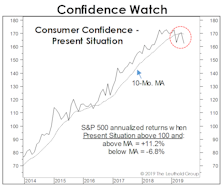
Why Is Confidence “Inverted?”

Stimulus and soaring stock prices have contributed to the fastest consumer-confidence rebound of any economic recovery on record. Yet the manner in which this bounce has unfolded is anything but “early cycle.”
Popular Trades — No “No-Brainers”

We studied several “popular trades” and there are good reasons to be on board with most of them, but none can be viewed as a no-brainer.
Remember The Yield Curve?
It would be a mistake to ignore (as most pundits will) this important forecasting tool until the next time it threatens to invert. The level and direction of the yield curve provide helpful information throughout the entire economic cycle.
No Yield Curve Control? The Fed Spoke Too Soon

There has been chatter about the Fed implementing the so-called Yield Curve Control (YCC). Although the latest FOMC minutes suggest that YCC is not on the agenda for now, we believe the chance of YCC is probably much higher than the market currently anticipates.
Double-Digit Yield & Double-Dipping Curves

As the coronavirus materially increases the odds of a recession, some important parts of the U.S. yield curve (10Y-3M; 5Y-2Y) double-dipped into inversion. The two prior episodes occurred in late 1989 and mid-2006 and, in both cases, a recession followed within 18 months.
Over-Stimulated?
We can’t count the number of times in the last week we’ve heard analysts worry about “what the Fed might know that we don’t.” In the words of John McEnroe, “You cannot be serious!”
How Will It Be Remembered?
A way to gain perspective on the present is by trying to view it from the future. Ask yourself, “What are the signs of impending decline, now ignored by investors, that will one day be memorialized by the same investors as the most obvious in retrospect?”
Questioning The Monetary Rebound
.jpg?fit=fillmax&w=222&bg=FFFFFF)
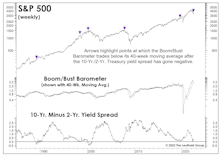
This year’s upswing in money-supply growth has been one of many factors that’s prevented our economic work from triggering a recession warning. Following a two-year decline, year-over-year growth in M2 bottomed near 3% late in 2018 and has trended upward all year, reaching 6.7% in the latest week (Chart 1).
More Yield Curve Musings

The U.S. yield curve inversion has lasted long enough that even a few economic optimists now concede it will ultimately prove significant.
More Trends We Don’t Find Friendly…
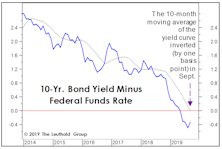
The yield curve’s ten-month moving average inverted in September, hence the yield curve inversion can no longer be dismissed as transitory; the Boom/Bust Indicator remains below its descending 10-month moving average, confirming economic weakness predicted by the yield curve; and, the “Present Situation” component of September’s Consumer Confidence survey slipped below its 10-month moving average for the third time in 2019.
Monetary Madness
We always do our own work and draw our own conclusions. Lately, though, we’ve wondered what the late “Monetary Marty” Zweig might say about the stock market’s current liquidity backdrop.
Recession Evidence: How Much Is Enough?
Over a 12-month horizon, we now believe a U.S. recession is very likely, but aren’t confident enough to make the call when the forecast window is cut in half. Second-half stock returns could be decent if the business-cycle peak is still a year away. Then again, there’s peril in waiting for “too much” confirmation of recession.
All That You Don’t Hear About The Curve

While the 10Y-3M curve inversion does warrant extra attention, movements in other parts of the curve also need to be taken into consideration.
Bust To Boom, And Back Again
Last month, we observed that crude oil was the only item propping up broad-based commodity indexes, and that something was bound to give with the U.S. dollar pushing to new highs.
Signs Of Spring For Financials
Signs of spring are popping up everywhere in the Financials sector. S&P Financials was easily the top- performing sector in April and several sub-industries have been bubbling higher in our Group Selection discipline.
Inveighing Against The Inversion

Some recent headlines are word-for-word regurgitations of those published in response to the early-2006 yield curve inversion. In that case, the naysayers were temporarily correct, as both the U.S. economy and stock market pushed higher for another year and a half before rolling over.
Watch What They Do, Not What They Say
While the celebration over Jerome Powell’s “Christmas Capitulation” lingered throughout February, we’re still awaiting signs the capitulation consisted of anything more than words.
Yields Might Be Throwing A Curve
While the number of recession forecasts is on the rise, there’s a general reluctance among economists to project a downturn in the absence of a yield curve inversion.
About That Great Jobs Report...

The December employment report temporarily eased fears of a severe U.S. slowdown. That’s a mystery to us.
Deep-Six The “Threes-Fives”
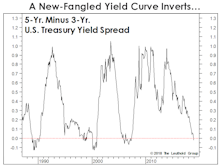
We’ve sometimes called the yield curve our “favorite economist,” so we were amused when some enthusiastic data miner in the Treasury market tried to slip us a cheap imitation in late November.
Beware The Policy “Narrative”

It’s been amusing to watch the narrative surrounding Fed policy evolve as the market has rallied.
Yield Curve Proxy—A Tool For Equity Investors

The increasingly greater attention given to the yield curve by equity investors has prompted us to come up with an equity basket that can track the movement of the yield curve. Overall, it does a reasonably good job of capturing the major moves.
Perception for the Professional
March 2026 Issue

Featured Articles
Sector Navigator
March 2026 Issue
