Inflation
The Decades They Are A-Changin’
More than halfway through the decade, a lot of things have changed. We revisit several decade-defining charts from the 2010s and consider where these long-running trends stand today.
Three Themes To Watch: Recession, Inflation, The Election
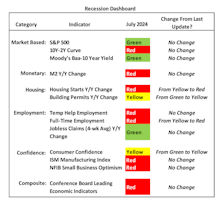
Is the market overreacting to recent economic data? Concerns about a growth slowdown are replacing the optimistic outlook of early 2024. Our Recession Dashboard shows increased risks, with notable declines in housing, employment, and consumer confidence. Despite this, equity and credit markets remain resilient. As we navigate these uncertain times, discover how upcoming elections and potential economic policies could shape the future.
Three Key Themes To Watch—Recession, Inflation & The Dollar
The probability of a soft landing has materially increased, while stronger than expected growth is likely to put a floor on inflation, which challenges the consensus disinflation view. A refresh of our Dollar Monitor suggests a weaker dollar going forward.
Inflation: Following The Script?
We know that historical analogs and averages can be overdone in market analysis, and our statistical approach (and maybe our longevity) makes us even more susceptible to looking for patterns that might not exist.
Marg-flation
The 2022 bear market will be remembered as a year when collapsing growth stock valuations and rising interest rates doomed almost every asset class to return purgatory. Hopes for avoiding a second down year rest with a potential top in interest rates and solid earnings underpinning the stock market. Wall Street strategists have a year-end 2023 price target of just over 4,000 for the S&P 500, a few percentage points of upside from today but hardly reason to toast a prosperous new year.
Goodbye Inflation, Hello Recession?
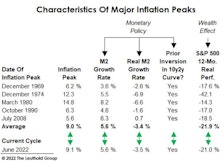
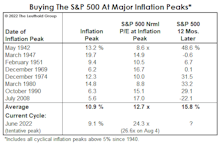
Unlike the five prior cycle peaks, this year’s inflation peak materialized during an ongoing economic expansion. That implies the “post-peak” monetary policy has never been tighter than today—making a soft landing even more improbable.
Research Preview: Inflation And Margins
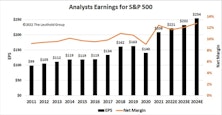
A new study looking at the relationship between inflation and profit margins is introduced. The goal is to understand how the latest margin peak was reached in mid-2021 and what impact inflation might have on margin forecasts underlying next year’s earnings estimates. Full report will be sent mid-month.
How This Year’s Inflation Peak Differs From Its Predecessors
Our studies of economic and stock market history are meant to provide perspective, not an investment roadmap. But occasionally a current trend will resemble the past so closely it’s eerie.
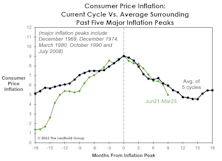
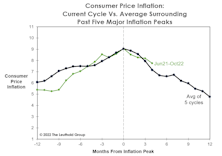
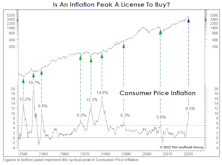
Take the current inflation cycle. If (as we believe) June’s CPI inflation rate of 9.1% represents the peak for this business cycle, then many of its characteristics have lined up almost perfectly with the “average” of past inflationary episodes.
Roaring Good Times...
Boy, were the pundits ever right about the Roaring Twenties. Less than three years into the decade, the animal they fear most has already roared two times. Actually, the first one, in the first quarter of 2020, was more like a piercing “yap,” taking the S&P 500 down almost 34% in just 23 trading days. The second roar has been a deeper, more guttural one that’s lasted nine months and is probably not done.
Labor: Snatching Defeat From The Jaws Of Victory
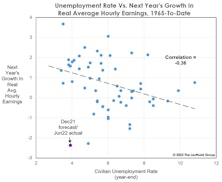
This year it’s been popular to say the Fed will hike interest rates until it “breaks something.” Has that not already happened? Pull up charts of the Japanese yen, the British pound, and the euro, among others. And stateside, the Fed has broken one of economists’ favorite toys: the Phillips Curve.
#54 - Inflation Fever Not Broken
The CPI figures were hotter than expected and point to more Fed intervention. Barring a 2020 collapse in the price index, year-over-year figures are going to remain high for quite some time.
It’s Been Ugly Across The Board
Aside from a couple specialized approaches, 2022 is shaping up as the second-worst year for “multi-asset” investing since at least 1973. It seems money printing supported more than just the equity subset.
No Rest For The Weary
If there’s a polar opposite to “Goldilocks,” this must be it. Not too hot and not too cold? What about both? Job growth and inflation are hot enough to force the Fed to follow through on its hawkish promises. But the leading indicators continue to warn us of oncoming cold. The odds that the porridge settles at the right temperature, without an intervening recession, look longer by the day.
Inflation Reduction Act—Corporate Tax Hike Implications
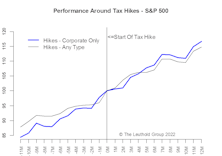
We take a look at the impact of past corporate-only tax hikes versus tax hikes of any type (personal income, corporate, capital gains). The gist is, there isn’t much difference at all.
Valuations: Living Beyond One’s Means?
We won’t dispute that investors were not genuinely frightened at the June market lows, or that fears have evaporated following a 13% rally in the S&P 500. The distress is understandable: For 26 traumatizing days in 2022, our S&P 500 Normalized P/E multiple traded below its 1957-to-date top decile!
Bear Market Rallies In Context
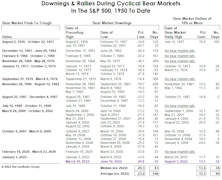
The 2022 bear market is the 13th cyclical bear since 1950, and it’s already joined the mightiest half of its predecessors based on the fact that it’s actually contained a bear-market rally. Six of the prior 12 bear markets weren’t interrupted by even one rally of at least 10%.
Remember When?
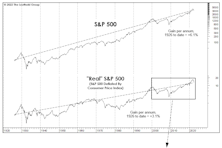
Remember the good old days (like even a year ago) when one didn’t need to mentally tabulate investment results in inflation-adjusted terms? For a blissful couple of decades, nominal and real returns were so close together that the latter figure seemed irrelevant.
More Signs Of Peak Inflation
As suggested in our June 24th, Chart of the Week, the peak in consumer inflation (+8.6% in May) has likely either occurred or is imminent. Consumers should thank the stock market, which in 2022 has taken up its occasional role as inflation-fighter after the Fed abdicated throughout 2021.
Break Out The Checkbook!
We apologize for that terribly misleading teaser of a title, but the bills for the stock-market mania of 2020-2021 are piling up. Inflation is one of them, lately increasing each month as relentlessly as cable TV used to. And for the 10% of households who own 90% of the stocks, market air-pockets such as June’s are like “surprise” medical bills: There’s rarely just one
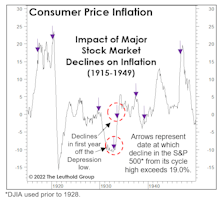
If Inflation Has Peaked, Thank The Stock Market—Not The Fed
High inflation continues to dominate the headlines, but it is only one piece of the “weight of the evidence” that’s stacked against the stock market. Still, in ironic fashion, stock-market action itself suggests that inflation is set to peak.
Your “Free Lunch” Comes With A Tab
The market impact from money printing has been underwhelming when adjusted for the inflation it’s unleashed. Measured from the peaks associated with the first attempt at Quantitative Tightening, in inflation-adjusted terms, Small Caps, EAFE, and Emerging Markets all have losses.
Should An Inflation Peak Be “Bought?”
Many economists recommend equity investors to instinctively and aggressively “buy” the inflation peak. History is on their side, though not as overwhelmingly as they might believe.
Stocks, Inflation, And Reverse Causality
Forget interest-rate hikes and quantitative tightening. There exists a very important weapon in the fight against inflation that the Fed did not have at its disposal in the 1970s: an overvalued stock market.
Consumers’ Misery Is Also The Fed’s
An already-low unemployment rate has dropped another 0.3% YTD (to 3.6%) and stocks’ rebound in the second half of March took the S&P 500 to within 3.5% of its all-time high. Yet Consumer Sentiment has sunk to 59.7—a reading that’s 15 points below the average seen at the last six NBER business-cycle troughs. Why the long faces?
Signs Of “Demand Destruction?”
They are simple measures, but our “NOPE” Indexes capture (as well as anything) the escalating inflation squeeze on businesses and consumers. To recap, the NOPE is the spread between the ISM New Orders Index and the Price Index, which can be calculated for both the Manufacturing and Services sectors.
Inflation: More Lighter Fluid!
For months, we’ve argued there are two ways of thinking about the current economic cycle. Economist types are likely to side with their brethren at the NBER, who say the recovery has entered its 23rd month. But those observing the broad range of economic and financial gauges might view this cycle as a single economic expansion dating back to mid-2009.
Market Gets A Speeding Ticket
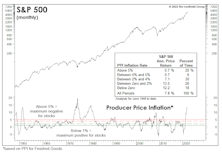
PPI and CPI inflation reached levels that were “too hot to handle” last April and July, respectively, yet the blue chips kept going up through year-end. Large Cap investors who trimmed stocks in response to the violation of these long-time inflation speed limits, however, haven’t missed out on much, and Small Cap investors who did so are happy.
What “Causes” Inflation To Decline?
Last year’s consensus view that inflation would prove “transitory” missed the mark. There’s no reason for shame; inflation forecasting hadn’t been a required investment skill for the previous 30 years.
“Collared” By The Fed?
In late January, the S&P 500 was down so much (almost 10%!) that it revived talk of investors’ favorite “safe” security. No, not T-bills—and not even Amazon or Apple common stock—but the Fed “put.” Years ago, we called it the “hypothetical” Fed put. But by now, we’re believers.
An Inflationary Wealth Effect
Causation between the economy and financial markets is never a clear thing. The optimistic group formerly known as “Team Transitory” believes a peak in the inflation rate is near, presumably clearing the way for even greater P/E multiple expansion than already seen in this cycle.
A 2023 Inflation Peak?
We don’t profess to be professional inflation forecasters, but are struck by a sort of “temporal” mismatch in the arguments used by those who believed the inflation pick up would be temporary. Specifically, the most commonly-cited bullish inflation arguments have been secular in nature, based on long-term trends in technological innovation, demographics, and free trade.
Is Powell A “Phillips Curve” Guy?
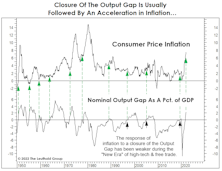
With consumer price inflation raging at 6.2% and few indications of an imminent rollover, Jay Powell has waved the white flag and retired the ill-begotten “transitory” descriptor. The timing of Powell’s concession is intriguing—perhaps he’s a fellow follower of a simple inflation model: the Output Gap.
Powell’s Dovish Accomplice
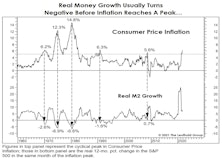
Last week we argued that U.S. money growth remains way too high to reasonably expect a peak in consumer price inflation during the next few months. At the peaks of the last five bouts of inflation of 5% or more, real growth in the M2 money supply had turned negative in four cases and had slipped to less than 1% in the other one. Today, real M2 is growing at nearly a 7% rate.
Timing Is Troubling For “Team Transitory”
From the start of the inflation upswing this spring, pundits cited well-known disinflationary factors they believe will soon halt the current inflationary upswing—like free trade, the speed of technological advance, and aging populations globally.
A Marginal Measure Of Margins?
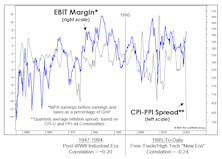
For those believers in a new economic- and stock-market era, there’s good news. The CPI-PPI spread has not been an effective proxy for profit margins during the 1995-to-date “New Era.” But, the failure of an inflation measure during a mostly non-inflationary era shouldn’t come as a surprise.
Manufacturing: More Citations For Speeding
It is much easier to predict inflation, itself, than to predict when investors will become traumatized by it. Some of the most helpful measures for the latter task come from the ISM Manufacturing Report. October’s readings saw three key measures above the statistical “speed limits” we calculated years ago.
Are Price Hikes The “New” Rate Hikes?
Notwithstanding the hit to consumers’ pocketbooks, it’s been amusing to follow the Fed’s recent evolution with its mindset regarding inflation. A year ago, the hope was for “symmetry”—Fed-speak for allowing inflation to run above its long-time 2% target, since it had previously undercut that level for awhile. Then, early in 2021, the word “transitory” entered the lexicon; yet months of debate and tens of thousands of utterances on financial television have clarified nothing about the Fed’s characterization of that term.
What’s Your “Number?”
Those in their peak earning years (40s and 50s) who’ve also enjoyed the stock market’s windfall gains are very likely to have seen their annual expenses climb much higher than the Consumer Price Index over the last several years.
Let Us Add To The Bullish Cacophony
It’s been a heck of a stock market year, and there are still four months left. What else could go right? Monetary conditions, for one thing—at least as proxied by our Dow Bond Oscillator (DBO).
The “Rule Of Twenty” Revisited
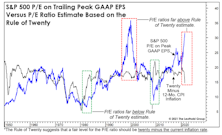
Pundits could reasonably argue the market has never been more expensive in light of the prevailing rate of inflation. That’s the conclusion of the “Rule of Twenty,” which proposes that the stock market’s P/E ratio and the trailing 12-month Consumer Price Inflation rate should sum up to 20.






.jpg?fit=fillmax&w=222&bg=FFFFFF)




.zip.jpg?fit=fillmax&w=222&bg=FFFFFF)
