Stock Market Internals Earnings Momentum, Small/Mid/Large Caps, Growth/Value/Cyclicals, and Additional Factors
Excellent Start To Q4 Reporting
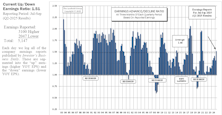
The first Up/Down ratio for Q4 is 2.63. Once again, this is another new high for the “one-month” ratio measured back to the amazing earnings growth following the 2020 EPS washout. Given the results of the past three quarters, this “contemporary record” storyline in our Up/Down work is feeling repetitive.
Valuations: Small Cap Vs. Large Cap
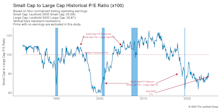
Despite all the talk about Small Caps ripping higher, the Ratio of Ratios narrowed only 1%. The S&P 600 (best SC proxy for this vignette) started 2026 off with a 5.6% gain. The Equal Weighted S&P 500 (best LC proxy), advanced 3.3%.
Leadership Dynamics: Growth/Value/Cyclical
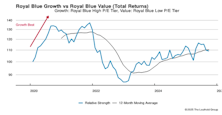
Since Halloween, RB Value (+12%) has been on a tear compared to RB Growth (-5%)—the best three-month stretch for RB Value relative to RB Growth since the start of 2022.
Other Market Undercurrents
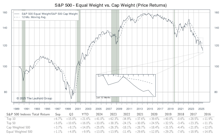
The Equal Weighted S&P 500 (+3.4%) had its best month versus the S&P 500 Top 10 Index (-0.9%)since March 2025. Poor results coming from MSFT (-11%), AAPL (-5%), and Broadcom (-4%) dragged down the once bulletproof Top 10. The average stock in the S&P 500 has now outperformed the largest ten for three consecutive months, with David beating Goliath by 8.5% during that span.
Recession Risk Low
The final Up/Down ratio for Q3 is 1.61—the highest “three-month” figure since Q2-21, and the second consecutive above-average reading. Our survey of around 5,000 firms continues to point to an EPS growth story that has extended to the most firms since the economic bounce following the pandemic.
Valuations: Small Cap Vs. Large Cap
Our Ratio of Ratios continued its never-ending sideways trek in 2025, ending the year right at its four-year moving average. We enter 2026 with this vignette advising that Small Caps can be purchased at a steep discount to Large Caps (just like the last six years).
Leadership Dynamics: Growth/Value/Cyclical
Royal Blue Value surged 10% and 8% in the last two quarters of 2025, nearly doubling the annual return of RB Growth (+16%).
Other Market Undercurrents
After barely dodging a bear market decline in April, the S&P 500 proceeded to surge 39% through year end. The Mag Seven stocks followed the same pattern in exaggerated form. All seven names ended 2025 in positive territory, but contributed much less to overall performance than the previous two years. Still, their effect over the past three years is overwhelming: S&P Top Ten Index +188% vs. the Equal Weighted S&P 500 +43%.
Gaining Steam
The latest Up/Down ratio is 1.64—the second consecutive above-average reading for this vignette. Since the GFC, outperforming quarters have most commonly appeared in chunks of four or five. Still, for now, the story of EPS-growth expansion continues to gain steam.
Valuations: Small Cap Vs. Large Cap
It’s been five long years since Small Caps had their last sustained relative-strength rally: From November 2020 through March 2021, the S&P 600 gained an astounding 51% versus the S&P 500’s +22%.
Leadership Dynamics: Growth/Value/Cyclical
Last month, Royal Blue Value (+3.5%) outdid RB Growth (-4.1%) for the first time since April 2022. Over the last two years, Royal Blue Growth is up 52%, just a bit more than Royal Blue Value’s gain of 51%.
Other Market Undercurrents
Five of the Magnificent Seven firms ended November in the red. Despite that turbulence at the top, the S&P 500 still managed to eke out a gain for the seventh-consecutive month. The valiant November effort from the index’s 2025 underdogs—Value, High Dividend, Low Volatility, and Equal Weight—won’t change much in the final assessment of the year.
Earnings Momentum Holds Firm
The Up/Down ratio reads 2.14. We have to go all the way back to October 2021 to find a higher “one-month” ratio. Aside from the Q1-25 hiccup, the ratio has advanced the past seven quarters and now sits at a level generally associated with a robust economy.
Other Market Undercurrents
An 8.5% gain, modest by Nvidia standards, propelled that firm to a congruent 8.5% weight in the S&P 500—a new record. The semiconductor firm also achieved the stock market’s first $5 trillion valuation last month. That’s a little larger than the annual economic output of Germany—or the combined output of Central and South America.
Up/Down Earnings Above Average!
The Up/Down ratio reads 1.51. This is the first time the “three-month” tally has been above the vignette’s 41-year average since Q3-21 (15 quarters ago). Both the level and the momentum of this survey would suggest that an economic recession is not imminent.
Valuations: Small Cap Vs. Large Cap
The Russell 2000 (lower-quality firms) has gained 12% YTD, while the higher-quality S&P 600 has advanced only 4%. Since we need P/E ratios to calculate this measure, firms with no earnings are excluded. For that reason, the ratio continues to sag.
Valuations: Small Cap Vs. Large Cap
Small Caps have come alive the past two quarters with the Russell 2000 posting a 21% price increase. Why hasn’t our Ratio of Ratios turned higher (lower SC discount)? This vignette excludes firms with no earnings. Note that the higher-quality S&P 600 has gained 13% since the end of March.
Leadership Dynamics: Growth/Value/Cyclical
Small Cap Growth continued its surge over Small Cap Value. From March forward, SC Growth has gained 30% versus +18% for SC Value.
Leadership Dynamics: Growth/Value/Cyclical
Russell 2000 Growth gained 26% since the end of March—the largest two-quarter bump for that index measured back to 2020. It fell just short of eclipsing its all-time high set in February 2021.
Other Market Undercurrents
With the second and third quarters’ results in the books, 2025 is back to following the exact same playbook seen the past two years. The eight largest firms in the S&P 500 posted an average return of +50% since the end of Q1. That octet—now a 37% index weight—has contributed a little over two-thirds of the S&P 500’s +20% return during the last six months.


