Cyclical Peak
Mapping Out The Eventual Earnings Recovery
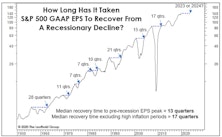
We view the coronavirus pandemic as the final straw that tipped an already vulnerable U.S. economy into recession, rather than the watershed event that will change the way we view growth, profitability, and even the nature of work itself. But even economic “optimists” like us need to recognize that the recovery back to last cycle’s earnings peak will be a long and grinding one. There’s a good chance that the four-quarter trailing S&P 500 GAAP Earnings Per Share cycle peak of $139.47 will not be exceeded until 2023 or 2024 (Chart 1).
Stocks And GDP
Economists argue the best thing the stock market has going for it is the continuation of the U.S. economic expansion. Maybe.
Charts Are In The Eye Of The Beholder
After last year’s 30% S&P 500 gain, many strategists are now suggesting that the real melt-up still lies ahead. We think a melt-up has already occurred, and the bulk of it has been booked.
More Yield Curve Musings
The U.S. yield curve inversion has lasted long enough that even a few economic optimists now concede it will ultimately prove significant.
Bull Pause, Or Bear Paws?
The old maxim says that when the bears have Thanksgiving, the bulls have Christmas.
To Play The Rally, Or Not To Play?
Question: What will you do if the Major Trend Index returns to its bullish zone?
All Together Now!
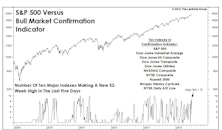
Our Bull Market Confirmation Indicator is tallying a healthy reading. This is intermediate-term bullish, and suggests that a final bull market top should be a minimum of four to six months away.
Time For A Spring Shower?
The stock market staged a two-day bearish reversal beginning a few hours after the release of the March employment report, a decline that could —based on the bearish status of a single MTI category (Attitudinal)—carry further before it is finished. But with the S&P 500 (and many other U.S. equity indexes) recording a bull market high as recently as April 2, it’s too early to argue the market top is “in.”
The Economy In 2014: Solid But Unspectacular
This year should be a solid but unspectacular one for the U.S. economy, with real GDP growth of about +2.5%. We expect the Consumer Price Index to rise just 1.5%. Unemployment should continue to fall.
The Rolling Stock Market Top Of 2013 (… And 2011, 2010, And 2009)
We’ve frequently mentioned the two-faced nature of thematic leadership during the current bull market. Filtering out the minor swings, Phase One lasted from March 2009 through February 2011 and was dominated by low quality, high beta and cyclical stocks.
Stocks And The Economy
We’ve written before about retail investors’ tendency to “conflate” stock market action with movements in the underlying economy. Misunderstanding this interrelationship generally causes the public to liquidate stocks when the economy is weak, only to ultimately buy them back when the economic recovery is obvious to all.
Inside the Stock Market
Our Major Trend Index is deteriorating. Most disturbing has been the continued deterioration in this work over the last few weeks as the overall market has seemingly improved. This is not typical.


