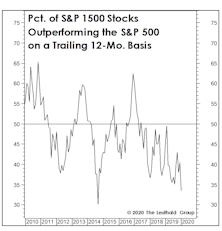
Economic Cycle
Special Study: Should You Buy The Dip? Some Statistical Considerations…
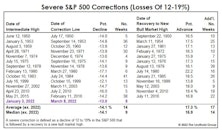
The correction in the S&P 500 since its high on January 3rd qualifies as a “severe” correction, which we define as a decline of at least -12% based on daily closing prices. What are the odds that it becomes a “major” decline*—in which the loss exceeds -19%?
In Section I, we review the history of severe corrections since 1950. In Section II, those corrections are analyzed in the context of the economic cycle, consumer sentiment, and other underlying factors—ones that might help us determine if today’s stock-market weakness is “buyable.”
Carbon-Dating The Recovery
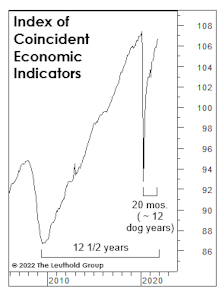
If January is the 21st month of the recovery, then time has elapsed in “dog years.” And that might put this “canine” recovery at around 12 years—just shy of where we might be had COVID never occurred!
Aging Prematurely
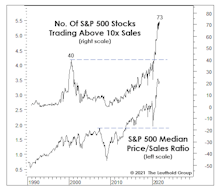
Regardless of one’s view on the maturity of today’s economic and market cycles, it’s hard to deny that the continuation of extraordinarily-loose economic policies is now causing those cycles to age prematurely. And no doubt it’s contributing to the premature “graying” of many market participants.
Style Rotation: Anything But Growth
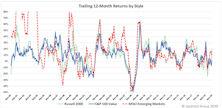
Driven by massive government stimulus, an imminent vaccine rollout, and the expectation of record earnings in 2021, investors seem to be on the verge of embracing a move away from Large Cap Growth stocks in earnest. The leading candidates offered as broad-based alternatives to Large Growth (LG) include Value, Small Caps, and Emerging Markets.
The Alternate Ending?
After last year’s spectacularly successful pivot following the December 2018 plunge, the thinking is that future rate hikes are the bull market’s only threat. Perhaps that will be the case; the belief is certainly well-supported by postwar U.S. economic history, but it also reveals a shocking lapse in short-term memory.
ISM Shows This Is A Different Kind Of Cycle
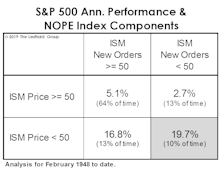
The manufacturing economy has thrown us a deflationary curve in 2019: The Price Index broke down in advance of New Orders, a reversal of the textbook recession/recovery sequence between these two measures.
We’re All Economists Now!
It’s now been more than 19 months since global stocks peaked on January 26th, 2018. Those lucky enough to have been invested solely in the S&P 500 and to have held on for the volatile ride have a 3.7% gain to show for it. Nice going.
Icing Over?
.jpg?fit=fillmax&w=222&bg=FFFFFF)
Will this economic cycle end with “fire” (overheating) or “ice” (a whiff of deflation)? Interestingly, hedges against both outcomes have performed well in recent months, with both gold and Treasury bonds spiking. For many reasons, though, we believe the U.S. expansion is more likely to end in a deflationary bust.
Deflation And Deception
.jpg?fit=fillmax&w=222&bg=FFFFFF)
We think the current economic cycle is more likely to end in a deflationary bust than with a bout of late-cycle “overheating,” and analysts and investors should recognize that such a cycle ending could be especially difficult to detect.
The Correction In Historical Context
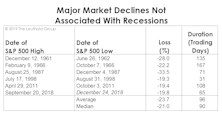
While it’s too early to let the ink dry on the accompanying table and chart, we’ve decided to add last year’s decline for comparative purposes.
Assessing The Cyclical Risks

With all the excitement over the Fed’s shift in rhetoric and the excellent subsequent market action, there’s a danger of losing sight of the broader cyclical backdrop for U.S. stocks. Remember, the economy is still operating beyond government estimates of its full-employment potential, and it’s not as if the Fed has actually eased policy—as it did successfully at a similar late-cycle juncture in the fall of 1998 and (ultimately unsuccessfully) in the summer of 2007.
Perception for the Professional
April 2026 Issue

Featured Articles
Sector Navigator
April 2026 Issue
