FANG
Pretty Darn Neutral
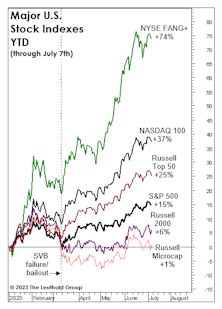
Last month’s title, “Echoes of 2021,” didn’t fully capture the speculative fervor that’s gripped big Technology stocks—and the NYSE FANG+® Index immediately set out to rectify that shortfall by tacking on another 5% to bring its YTD return to +74%.
A Look At Where Rate Hikes Are “Working”

Speculative spirits are back, and the index that’s suddenly close to its 2021 high is the one we viewed as the epicenter of the mania—the NY FANG+® Index!
Echoes Of 2021
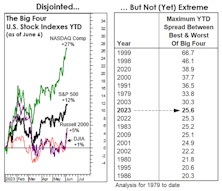
The NY FANG+® Index is up 68% YTD and +21% in the last month, with the Equal-Weighted S&P 500 up less than 2% YTD. Yet a measure of internal market disparity has 2023 barely cracking the top-ten of “incongruent” market years—meaning it can get worse before it gets better.
What Is Narrower Than “Narrow”
.jpg?fit=fillmax&w=222&bg=FFFFFF)
The May Green Book, published a short three weeks ago, included an article titled “Market Narrowness in 2023” discussing the Big Tech theme’s market leadership this year. We noted that 77% of the S&P 500’s year-to-date return through April 30th was produced by the nine S&P 500 members of the NYSE FANG+® Index, itself a collection of just ten large companies that dominate the Social/Cloud/Innovators cohort. (As for which FANG+ company is not also in the S&P 500, that is your puzzle challenge for this long weekend.)
Sliced Breadth
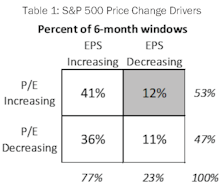
The S&P 500 posted a 7.7% price gain for the six months ended April 30th, although this advance has been a hard-fought battle as gains have resulted from a narrow list of drivers. Style leadership has been concentrated in mega-cap tech names, such that the ten members of the NYSE FANG+® Index have produced 77% of the S&P 500’s YTD gain. Furthermore, gains over recent months have resulted solely from expanding multiples. Narrowness in either thematic leadership or price drivers is concerning because breadth is a useful concept in evaluating the staying power of a market advance. In light of this year’s market action, we are intrigued by the notion of measuring breadth not simply by price moves alone but by examining each of these two important sub-components individually. Does today’s environment, where price gains are driven by valuation increases alone, tell us anything about future market returns?
Herd Instinct

Growth and Tech have been the flagrant winners YTD, yet the SVB crisis triggered further bifurcation: Since SVB failed, it’s been important to own only “big” Growth and “big” Technology, amplifying the multiples of monster stocks, like MSFT and AAPL. Can a major market low occur when investors are herded in a handful of the most richly-priced public companies in history?
Research Preview: Market Narrowness In 2023

The S&P 500 posted an encouraging +9.2% YTD, but below the surface that strong return was the result of a limited number of influences. There is narrowness in both thematic and return drivers; the fact that gains have not been broad-based is cause for concern about performance during the remainder of 2023.
Reading The Short-Term Tea Leaves

The stock market’s technical backdrop remains pretty hard to assail, as evidenced by the current +4 reading on the revamped MTI’s Technical category. But there are a few short-term cracks that bear watching.
Styles And Factors DeFANGed

Social media, mobile computing, and digital life-in-the-cloud were the dominant storylines for U.S. stocks over the last five years—reaching the apex of popularity following the early-2016 market low.
Perception for the Professional
March 2026 Issue

Featured Articles
Sector Navigator
April 2026 Issue
