GAAP EPS
Valuations: What Bear Market?
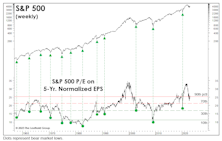
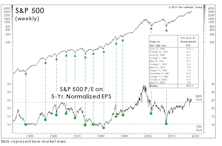
If the October S&P 500 low holds, the normalized P/E ratio of 22.7x on that date will signify the priciest bear market bottom in history; in fact, it is exactly the same level reached as at the August-1987 bull market high. Since October, the normalized P/E multiple has grown to 25.5x—higher than all but three previous bull market peaks.
Peak Earnings Yield A Rock-Bottom Forecast
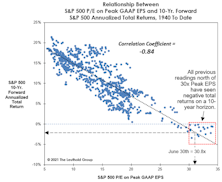
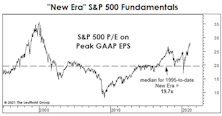
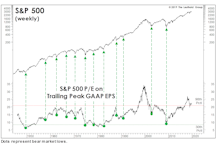
At today’s 30.8x, the Peak P/E stands in the 99th percentile on all time horizons except the “New Era” (1995-to-date). Yet, that’s still five “handles” below the 35.8x all-time high recorded in December 1999. If that figure is matched, the S&P 500 will top 5,000.
Music For The “Mania”
At some point during the June/July streak of seven-consecutive S&P 500 daily-closing highs, an album from 1980 popped into our heads: Nothin’ Matters And What If It Did—released when John Mellencamp was still known as John Cougar. It brought to mind some “nothin’s” that seem not to matter.
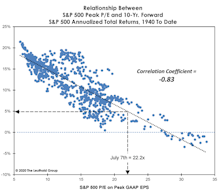
Sizing Up The Profit Recovery
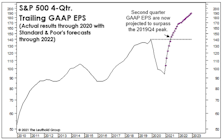
We don’t make much use of “Forward” EPS for the S&P 500 because analyst forecasts have tended to be hopelessly optimistic. But if their short-term projections are on target, when numbers for the current quarter are reported, 12-month trailing GAAP EPS will exceed the $139.47 pre-COVID peak.
A “New-Era” Look At The Future
Young readers sometimes give us a not-so-subtle roll of the eyes when we discuss any sort of stock market history that occurred before their date of birth, but it takes experience to appreciate that “there’s nothing new under the sun—least of all in the stock market.”
Low Single Digits?
We encourage diversity of thought in our shop, but even pessimists among our ranks have a hard time making the case for a ten-year negative return for U.S. stocks, which was recently predicted by the founder of a large hedge fund.
“Peaking” Into The Future
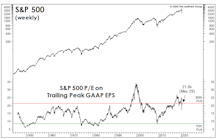
Peak P/E has just moved into its top decile on a postwar basis. If the recent rally is indeed the first roar of a new bull, then this is a bull that’s a “baby” on a calendar basis, but quite elderly from a “character” perspective.
Mapping Out The Eventual Earnings Recovery
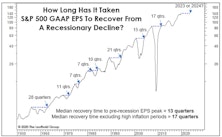
We view the coronavirus pandemic as the final straw that tipped an already vulnerable U.S. economy into recession, rather than the watershed event that will change the way we view growth, profitability, and even the nature of work itself. But even economic “optimists” like us need to recognize that the recovery back to last cycle’s earnings peak will be a long and grinding one. There’s a good chance that the four-quarter trailing S&P 500 GAAP Earnings Per Share cycle peak of $139.47 will not be exceeded until 2023 or 2024 (Chart 1).
A Spectacularly Average Thirty Years
In the spirit of good holiday cheer, we made a partial concession to the True Believers with a December “Chart of the Week” in which we narrowed our stock market valuation analysis to the historically elevated levels of last 30 years.
A “Best Case” Bear Scenario?
We intentionally curtailed our discussion of stock market valuations the last few months to allow the “dead horse” to recover from the thrashings administered in recent years. Now we’re rested, refreshed, and ready to deliver a few more lashes.
Pricing In “Peak” EPS
A recent theme in our valuation work is that we no longer need to assume a full-blown “reversion to the mean” to illustrate current U.S. stock market risks: Even a reversion to “old” bull market highs in ratios like S&P 500 Price/Sales, Price/Cash Flow, and Normalized P/E would result in bear-sized losses.
Perception for the Professional
March 2026 Issue

Featured Articles
Sector Navigator
March 2026 Issue
