ISM New Orders Index
Revisiting The 1966 Forecast Failure
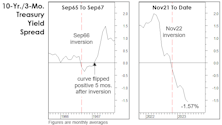
Developments over the last four months leave us even more skeptical that the November yield-curve inversion will join 1966 as a “false positive.” The number one reason being the subsequent shift in the yield curve itself.
The Yield Curve And The Problem Of Timing
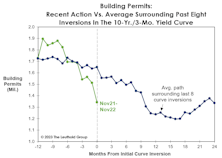
Frequently, there’s money to be made in the stock market in the months following the initial curve inversion. After the inversions of August 2006 and June 2019, the S&P 500 rallied another 23% and 19%, respectively, into its final bull market high. If this cycle plays out in textbook fashion, the business-cycle peak would arrive in September.
No Longer An Emphatic “NOPE”
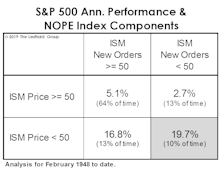
While the MTI’s Cyclical category remains hostile at -3, we’ve observed steady improvement in its leading inflation components. Especially notable is the reversal in the NOPE Index (ISM New Orders Minus Price Index).
Looking “Bustier?”
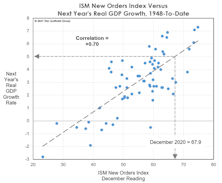
Key indicators are indeed trending in “pre-recessionary” fashion. Among them is the ISM New Orders Index, which dipped into contraction territory in June while inventories increased. Others are the JOLTS that shows a strong (but weakening) labor market, and unemployment claims—which have ticked up.
“Plotting” The Course For 2022
The economic expansion officially entered its 22nd month in February. In dog years, that translates to an age of 13—the same age the recovery might have reached this July if not for the COVID disruption. The late-cycle characteristics displayed by a recovery that’s statistically so young dissuade us from issuing a high-conviction forecast for 2022.
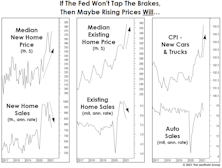
Are High Prices A Form Of “Tightening?”
It’s certain that today’s cyclical bout of inflation will prove “transitory,” if only because the word itself is practically meaningless. Our time on earth will also prove transitory, and so too will the current stock market mania—to the shock of most of the nearly 20 million “investors” on the Robinhood platform.
The Case For “Five Percent”
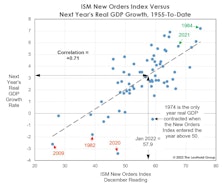
Forecasting GDP is hardly our forte, but 2021 should see a very big gain in real output. Our current guess is for real GDP to grow 5% this year. Statistically, though, that doesn’t imply that the stock market’s move will also be large (or even of the same “sign”).
ISM Shows This Is A Different Kind Of Cycle
The manufacturing economy has thrown us a deflationary curve in 2019: The Price Index broke down in advance of New Orders, a reversal of the textbook recession/recovery sequence between these two measures.
Yields Might Be Throwing A Curve
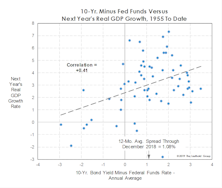
While the number of recession forecasts is on the rise, there’s a general reluctance among economists to project a downturn in the absence of a yield curve inversion.
About That Great Jobs Report...
The December employment report temporarily eased fears of a severe U.S. slowdown. That’s a mystery to us.
