Key Index Performance
X-Rays And EKGs
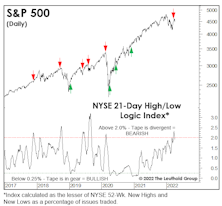
In late March, the S&P 500 rallied to within 3.5% of its January high, likely prompting producers at CNBC to put in an order for “S&P 500 5,000” hats. But we think that 4,000 will be undercut before 5,000 is topped, and action in key indexes (with the notable exception of the S&P 500 itself) reinforces our view.
Everyone Loves A Winner
The bullish consensus seems to be that unlimited Fed liquidity will lift all stock market and economic boats. However, past liquidity floods have tended to lift boats that were already the most buoyant. The “Y2K Liquidity Facility” and last fall’s emergency Fed intervention in the overnight repo market are two cases in which liquidity seemed to flow to where it was needed the least.
A Bear Till Proven Otherwise
Major Trend Index remains decisively negative at 0.72. The “market action” category is the primary culprit behind this bearish tally, but we’ve also seen the Economic category deteriorate in recent months and would expect this trend to continue. This sequence is typical: Market action leads economic trends (and, we would argue, is a major cause of those trends).


