Low Volatility Index
Bond Yields “Take Down” An Old Favorite

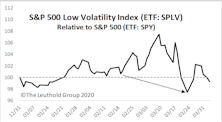
The “lower for longer” interest-rate thesis propped up the S&P 500 Low Volatility Index for more than a decade. Rising bond yields have since helped drive this former darling to an 18-year relative-strength low. Yet, assets in the S&P Low Volatility ETF are still five-times larger than its High-Beta counterpart.
The Chart Everyone Missed
.jpg?fit=fillmax&w=222&bg=FFFFFF)
When we first met Steve Leuthold in the old company office in a renovated warehouse, he was updating a several-foot-long chart of either the DJIA or S&P 500, by hand, and we got a brief lecture on the importance of using logarithmic scale on price charts.
Popular Low/Minimum Volatility Strategies Disappoint
During the peak-to-trough market drawdown through mid-March, some of the most popular Low/Min Vol ETFs did not perform as anticipated. Stable and boring businesses, that weather downturns relatively well, are facing atypical vulnerabilities.
The Stock Market’s Clark Kent
.jpg?fit=fillmax&w=222&bg=FFFFFF)
Mild-mannered and humdrum on the surface but a superhero underneath—that’s Clark Kent and, in recent months, the Low Volatility factor. Low Vol stocks are unexciting by definition, and the factor’s current holdings focus on utilities, REITs, and insurance companies.
Low Vol For All Seasons?

The early August setback took the S&P 500 below its late-January 2018 high—and the time when we first trimmed net equity exposure in Leuthold tactical funds from a nearly fully-invested posture.
Low Vol For All Seasons?

The S&P 500 Low Volatility Index has performed so well for so long that the ETF based on the index has amassed more than $8 billion.
A Harbor In The Tempest

Our Major Trend Index (MTI) recently fell from “positive” toward stocks to a “neutral” reading, leading us to trim bullish equity positions in our tactical portfolios.
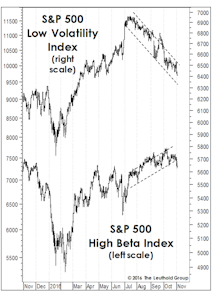
High Beta Breakout?
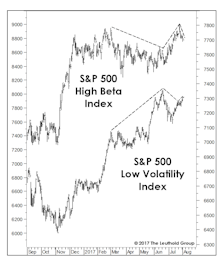
Last month we spent a full page explaining why the underperformance of the S&P 500 High Beta Index was not a bearish portent for stocks (Chart 1).
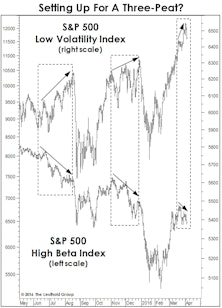
What Does The Low Vol Divergence Mean?
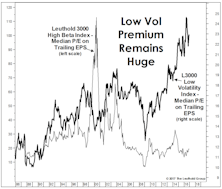
Low Volatility stocks have been the darlings of this bull market, and Low Vol is now considered a long-term “alpha generator” alongside such Hall of Fame quant factors as Low P/E and Price Momentum.
Still In Thrall With Low Vol

Ongoing investor obsession with stability strikes us as considerably more dangerous than the situation in the Tech sector. While many see market parallels with 1999, we instead see a mirror image.
Tilt Toward Beta
Stock market valuations certainly show no lack of investor confidence: each of our “Big Six” valuation measures now resides in either its ninth or tenth historical decile.
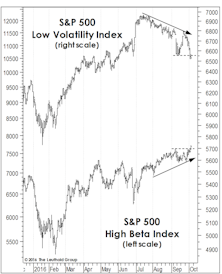
The “Low Vol” Unwind: Just The Beginning?
In mid-summer we suggested that attaining new market highs would probably require a rotation away from the long-time Low Volatility market leaders and into High Beta areas like Technology and industrial cyclicals.
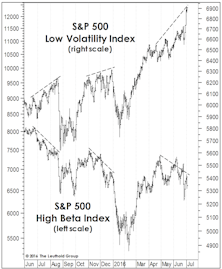
Beta Rotation Underway
For months we’ve speculated that any major extension of the bull market would require a rotation into High Beta groups from the Low Volatility and economically-defensive themes that were the market’s big winners from mid-2015 to mid-2016.
Rotation Away From Low Vol?
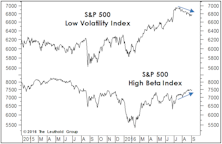
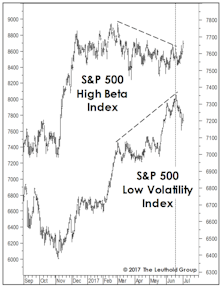
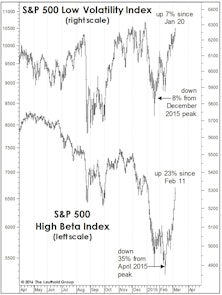
An encouraging break from a 15-month leadership pattern: Low Vol stocks have rolled over since mid-July, while the High Beta cohort has finally eclipsed its late-April highs.
Low Vol Divergence, Episode 3
The divergence between S&P 500 Low Volatility and High Beta Indexes has emerged for the 3rd time in a year. The 3-month performance spread is even more extreme than it had been on the eve of either the August or December stock market air pockets.
Stock Market Observations
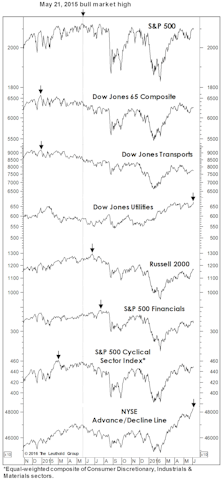
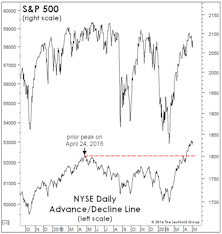
Commentators now label this cyclical advance the “seven-year bull market,” but that won’t be semantically true until the S&P 500 closes above its May 2015 peak of 2130.82.
Sizing Up The Rally
While our MTI became bullish in mid-April, we can’t rule out that the rebound from February lows could be an impressive bear market rally. However, this rally sports impressive technical credentials.
Stock Market Observations
The stock market rally off the February 11th lows has been powerful enough to lift the Major Trend Index into its Neutral zone (in fact, a high-neutral ratio of 1.04), and therefore certainly deserves some level of respect.
Beta Back In Vogue?
High Beta has certainly lived up to its billing, during both the multi-month decline and the three-week rally off the February 11th correction low.
Two Worrisome Bull Market Highs

Among the dozens of indexes we monitor, the year’s final all-time highs (S&P 500 Consumer Staples and S&P 500 Low Volatility Index on December 29th) can’t possibly provide any comfort to stock market bulls.
Perception for the Professional
March 2026 Issue

Featured Articles
Sector Navigator
March 2026 Issue
