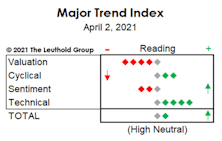
Major Trend Index
Neutral (But Leaning Negative)
U.S. stocks have either begun one of the most underwhelming and economically illogical bull markets in history, or have staged an exceptionally long and deceptive bear market rally. Our bet is on the latter.
Pretty Darn Neutral
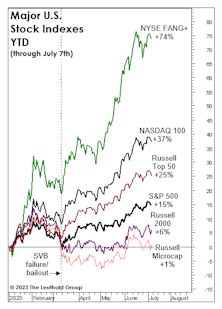
Last month’s title, “Echoes of 2021,” didn’t fully capture the speculative fervor that’s gripped big Technology stocks—and the NYSE FANG+® Index immediately set out to rectify that shortfall by tacking on another 5% to bring its YTD return to +74%.
Waking From A Slumber?
We’re very skeptical that the rally from last October’s low represents the first leg of new bull market. But if it is—as many believe—then it has unquestionably inherited the worst set of genes we’ve ever observed in the species.
Economy Soaking Up Scarce Money Supply
There might be “too much money chasing too few goods,” but some monetary measures imply there’s “no longer enough money” to finance production of those goods and still support a stock market that’s far from cheap.
A 2022 Trifecta?
Our Major Trend Index has four factor categories, and three of them (Valuation, Cyclical, Technical) remain negative. Yes, the bearish “trifecta.” If that sounds like a reprint of one of our Monday MTI memos, bear with us (pun intended). We thought the MTI—with over 125 inputs—was pretty exhaustive. It turns out that it’s lacking entire categories pertinent to stock market action:
Tightening Into A Slowdown: Month Eight

We think the U.S. economy will slip into recession sometime in the next year, but the level of “excess savings” provided by pandemic aid renders the already difficult task of timing more elusive than ever.
Fake-Out Or Break-Out?

“Don’t fight the Fed” was profitable advice dispensed almost daily by bulls in the 2nd half of 2020 and all of 2021. It’s been valuable advice in 2022, as well. However, when the Fed turned hostile earlier this year, the bulls deviated from their own sound advice and looked for new narratives.
Overheated?

Living in Minneapolis, we’re bewildered by the absence of research considering global warming as potentially a good thing for certain organisms. That’s especially true for creatures where the science is almost nonexistent—like the stock market. Record heat wave? Bring it on!
Welcome To The Terrible Twos!

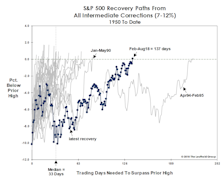
In late March, the S&P 500 came close enough (3.5%) to its January high that a second birthday celebration for the bull seemed warranted. Who doesn’t love a party? But, as we noted in a recent Chart of the Week, a milestone like this is a good excuse to haul our pet to the veterinarian for a checkup.
A Failure of "Free Money"
Senator Rand Paul’s annual “Festivus” report on wasteful spending makes for sobering reading to the dwindling few who care about federal finances. The “low light” for 2021 was a $465,000 grant to the National Institute of Health for a study of pigeons playing slot machines.
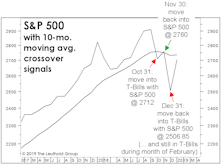
The Trend Is A Bit Less Friendly
The MTI’s move to its Negative zone with the October 1st reading was driven by a few trend breakdowns—ones that could well reverse in short order. Recognizing the volatility of these signals (and perhaps having been “conditioned” by the one-way market of the last 18 months), we opted for just a minor asset allocation adjustment.
These “Insiders” Have Exited; Should You?
What if the S&P 500’s September 2nd closing high were to miraculously stand as the cycle’s high-water mark? If it did, the peak was presaged—in retrospect—by two Federal Reserve Bank presidents who rode the liquidity wave all the way to its crest after assuring the floodgates would be left wide open. Both resigned in September.
Flesh Wounds, Or Something Deeper?
At the August 5th, S&P 500 bull-market high, seven of our eight bellwethers had failed to make a “confirming” high during the prior month of trading—up from six non-confirmations a month ago. “The dog that didn’t bark” (yet) is the S&P 500 Equal Weighted Index.
Introducing The “New” MTI
We launched a revamped version of our Major Trend Index. The objective of the new methodology is to increase the flexibility, and even the subjectivity of the MTI. This approach recognizes the “subjective reality,” without forcing us into the tedium of re-weighting sub-factors if they become more or less critical as market dynamics evolve.
The “New” MTI Debuts At High Neutral

Read this week's Major Trend.
Interim Memo
The coronavirus epidemic/pandemic is getting the bulk of the blame for the sudden collapse in U.S. equities, and certainly qualifies as one of the few “black swans” seen in modern market history. We do not think the ultimate path of the coronavirus contagion can be analyzed at this point, and medical experts foresee possible outcomes ranging from a serious epidemic to a short burst of illness that fades with the summer weather.
Mid-Year Mea Culpa
The S&P 500 has rallied 9.2% in the 22 trading days since its June 3rd low, but the move hasn’t (yet) been enough to lift the Major Trend Index out of its negative zone.
Stock Market Observations
It’s telling that the stock market rally off of the Christmas Eve lows—impressive as it was (and, for some investors, painful)—did not manage to lift the Major Trend Index beyond its neutral zone.
Trend-Following Travails
To recap our allocation moves over the last year: We established an initial equity hedge in tactical accounts very close to the January 2018 highs.
It’s About Money, Not Profits
.png?fit=fillmax&w=222&bg=FFFFFF)
The consensus focus all year has been on the boom in U.S. corporate profits.
Breakout Or Fake-Out?
The S&P 500 has fully erased its January and February losses, but there’s probably a market message in the fact that it took so long to do so.
MTI: Market Sentiment Is Overconfident

The Attitudinal category neared a new negative extreme for the rally off February lows, while the Intrinsic Value category reached a new extreme for the entire bull market. This combination of overvaluation and overconfidence will eventually be resolved with large market losses…
MTI: Modest Gains In Three Categories
.jpg?fit=fillmax&w=222&bg=FFFFFF)
Daily and weekly versions of all the advance/decline lines we track stood at cycle highs at week’s end, which—alongside the high in the Value Line Arithmetic Average—makes it hard to argue the market has narrowed significantly.
MTI: No Major Swings

Improvement in the Momentum work has been insufficient to offset weakness elsewhere, leaving the weight of the evidence still bearish. However, persistent strength in this category has been enough to discourage us from establishing additional equity hedges in our tactical funds.
MTI: Confidence Builds As S&P Flirts With High

The Attitudinal-category reading has moved to a six-month extreme as the S&P 500 flirts with its January high; improvement in the Economic work continues to reflect the pullback in various commodity measures.
MTI: Sentiment Continues To Build

Sentiment toward stocks continues to heat up. Our S&P 500 Liquidity Premium shows that speculation in individual stocks is picking up relative to ETF trading, a negative sign. In addition, activity in stock index options shows the “smart money” rebuilding a bearish position.
MTI: Inflation Measures Retreat

Our 52-week diffusion index on a 70-commodity basket now registers essentially neutral, while all of the non-energy commodity price sub-models have improved.
MTI: Market Not As Healthy Under The Surface

We’d concede that neither the relative strength of Small Caps nor the divergently strong action of the NYSE Daily Advance/Decline Line fit the pattern of a stock market undergoing a late-cycle period of distribution, however, the relatively low percentage of NYSE issues now trading above their 30-week moving averages (45.5%) suggests the market may not be as internally healthy as popularly portrayed.
MTI Suggests Risks Still Elevated
After several weeks of muted movements, three MTI categories saw swings of more than 60 points. The Supply/Demand category’s loss was the biggest move, and mostly reflected commercial hedgers’ sudden unwinding of a big net-long position in stock index futures. Such action causes this important “smart money” indicator to be more in line with the DJIA’s Smart Money Flow Index, which continues to act badly.
MTI: Market Behavior Remains Disjointed

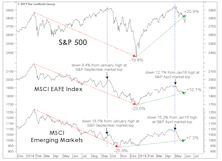
Performance discontinuities across some of the major indexes are striking. For example, while the NASDAQ Composite is up 12% YTD, the NYSE Composite is down 1%, despite those strong A/D readings for the latter index. Today’s action leaves a similar gap between the Russell 2000 (up 10% YTD) and the DJIA (unchanged).
MTI: Big Attitudinal Drop
The decline in the attitudinal work was fairly broad based, with a few indicators even moving back to maximum negative readings.
Is Market Breadth Misleading?

The stock market has narrowed, but not in the way we envisioned—nor in a way that’s consistent with most historical bull market tops. Small Caps and market breadth measures are traditionally the first to wilt when monetary tightening begins to hit the stock market. Instead, they are the leaders.
MTI: Sentiment Measures Decline

A sharp loss in the Attitudinal category reflects declines in all major groupings of sentiment measures, ranging from investor opinion surveys, to fund flows, to option trading activity.
MTI: Supply/Demand Measures Deteriorate

Supply/Demand work experienced the week’s largest category loss and reflects declines in the Smart Money Flow Index (which tracks opening and closing action in the DJIA) and in our Institutional Accumulation measure, which compares up and down volume to prevailing price action.
MTI: Daily A/D Numbers Suggest Strength

The daily advance/decline numbers suggest the recent bounce has been broad, but analyses based on the 52-week highs and lows (including various versions of the “High/Low Logic Index”) are flashing warning signals similar to the ones seen in the fall of 2007 and summer of 2015.
MTI: Monetary And Liquidity Work Deteriorates

While we’ve always emphasized the importance of the “weight of the evidence” over the individual MTI factor categories, it’s worth highlighting some key differences between the 2018 correction (which saw a loss in the S&P 500 of 10.2% at the February 8th closing low) and the 2015-2016 S&P 500 correction of 14.2%.
MTI: Momentum Remains Surprisingly Solid

It’s mystifying that the Momentum work has not deteriorated further during the course of this correction. Despite the -9.3% S&P 500 loss through Friday’s close, the net category reading remains at a moderately bullish level.
Change In Market Character
The Major Trend Index fell into its negative zone last week and we trimmed the already below-average net equity exposure in tactical accounts by a few more points, to a current 41-42%.
MTI: Momentum Rebounds

The Momentum category rebounded 49 points last week, reflecting small gains across most of the quantitative chart scores…
MTI: Attitudinal Strengthens Further

Subjectively, we sense that investor sentiment has rebounded (too?) rapidly following the stock market’s air pocket earlier this month. Statistically, though, we’ve found that many of our sentiment measures perform better when the observations are smoothed using various moving average lengths.
Perception for the Professional
March 2026 Issue

Featured Articles
Sector Navigator
March 2026 Issue
