MBI Readings
VLT: You Read It Here Last
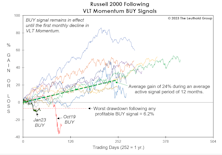
We anticipated it for months, and now that it has finally happened, we’re burying the news in the final page of this section. Yes, the last day of March saw the S&P 500 trigger a “low-risk” BUY signal on our Very Long Term (VLT) Momentum algorithm, known elsewhere as the Coppock Curve.
In The “Eye” Of The Beholder

Stocks could trade higher in the next few months as CPI numbers enjoy easy year-to-year comparisons, prompting a more soothing tone in daily Fed-speak. Then again, the lagged impact of the last year’s rate hikes and balance-sheet shrinkage has yet to materialize, meaning we’re likely in the eye of the storm.
“Not Quite” Super

The average “super-overbought” MBI reading occurred 54 days after a market low; June 4th marks the 51st trading day since the March 23rd low. Thus, any signal in the days ahead would arrive essentially “on time,” but the slippage (the S&P 500 gain already realized) would be enormous at around 40%!
Perception for the Professional
March 2026 Issue

Featured Articles
Sector Navigator
March 2026 Issue
