MTI
Neutral (But Leaning Negative)
U.S. stocks have either begun one of the most underwhelming and economically illogical bull markets in history, or have staged an exceptionally long and deceptive bear market rally. Our bet is on the latter.
Pretty Darn Neutral
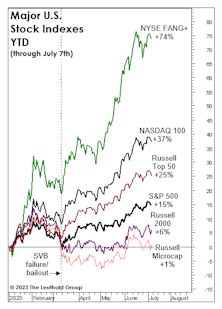
Last month’s title, “Echoes of 2021,” didn’t fully capture the speculative fervor that’s gripped big Technology stocks—and the NYSE FANG+® Index immediately set out to rectify that shortfall by tacking on another 5% to bring its YTD return to +74%.
Waking From A Slumber?
We’re very skeptical that the rally from last October’s low represents the first leg of new bull market. But if it is—as many believe—then it has unquestionably inherited the worst set of genes we’ve ever observed in the species.
No Punch Bowl? No Problem!
Stocks are off to a strong start in 2023, and speculative juices are again flowing. In the final week of January, NASDAQ trading volumes were eight times those of the NYSE, a level seen only at the very peak of the meme-stock mania in early 2021. (Pre-COVID, the ratio oscillated between two and three. It’s a brave, new world.)
Economy Soaking Up Scarce Money Supply
There might be “too much money chasing too few goods,” but some monetary measures imply there’s “no longer enough money” to finance production of those goods and still support a stock market that’s far from cheap.
A 2022 Trifecta?
Our Major Trend Index has four factor categories, and three of them (Valuation, Cyclical, Technical) remain negative. Yes, the bearish “trifecta.” If that sounds like a reprint of one of our Monday MTI memos, bear with us (pun intended). We thought the MTI—with over 125 inputs—was pretty exhaustive. It turns out that it’s lacking entire categories pertinent to stock market action:
Tightening Into A Slowdown: Month Eight
We think the U.S. economy will slip into recession sometime in the next year, but the level of “excess savings” provided by pandemic aid renders the already difficult task of timing more elusive than ever.
Fake-Out Or Break-Out?
“Don’t fight the Fed” was profitable advice dispensed almost daily by bulls in the 2nd half of 2020 and all of 2021. It’s been valuable advice in 2022, as well. However, when the Fed turned hostile earlier this year, the bulls deviated from their own sound advice and looked for new narratives.
Overheated?
Living in Minneapolis, we’re bewildered by the absence of research considering global warming as potentially a good thing for certain organisms. That’s especially true for creatures where the science is almost nonexistent—like the stock market. Record heat wave? Bring it on!
Welcome To The Terrible Twos!
In late March, the S&P 500 came close enough (3.5%) to its January high that a second birthday celebration for the bull seemed warranted. Who doesn’t love a party? But, as we noted in a recent Chart of the Week, a milestone like this is a good excuse to haul our pet to the veterinarian for a checkup.
The Trend Is A Bit Less Friendly
The MTI’s move to its Negative zone with the October 1st reading was driven by a few trend breakdowns—ones that could well reverse in short order. Recognizing the volatility of these signals (and perhaps having been “conditioned” by the one-way market of the last 18 months), we opted for just a minor asset allocation adjustment.
These “Insiders” Have Exited; Should You?
What if the S&P 500’s September 2nd closing high were to miraculously stand as the cycle’s high-water mark? If it did, the peak was presaged—in retrospect—by two Federal Reserve Bank presidents who rode the liquidity wave all the way to its crest after assuring the floodgates would be left wide open. Both resigned in September.
Flesh Wounds, Or Something Deeper?
At the August 5th, S&P 500 bull-market high, seven of our eight bellwethers had failed to make a “confirming” high during the prior month of trading—up from six non-confirmations a month ago. “The dog that didn’t bark” (yet) is the S&P 500 Equal Weighted Index.
Podcast #33 - Introducing the New MTI
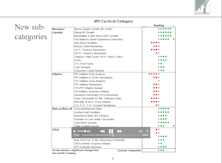
We launched a revamped version of our Major Trend Index. The objective of the new methodology is to increase the flexibility, and even the subjectivity of the MTI. This approach recognizes the “subjective reality,” without forcing us into the tedium of re-weighting sub-factors if they become more or less critical as market dynamics evolve.
Introducing The “New” MTI
We launched a revamped version of our Major Trend Index. The objective of the new methodology is to increase the flexibility, and even the subjectivity of the MTI. This approach recognizes the “subjective reality,” without forcing us into the tedium of re-weighting sub-factors if they become more or less critical as market dynamics evolve.
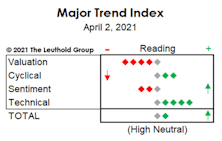
The “New” MTI Debuts At High Neutral
Read this week's Major Trend.
Interim Memo
The coronavirus epidemic/pandemic is getting the bulk of the blame for the sudden collapse in U.S. equities, and certainly qualifies as one of the few “black swans” seen in modern market history. We do not think the ultimate path of the coronavirus contagion can be analyzed at this point, and medical experts foresee possible outcomes ranging from a serious epidemic to a short burst of illness that fades with the summer weather.
Mid-Year Mea Culpa
The S&P 500 has rallied 9.2% in the 22 trading days since its June 3rd low, but the move hasn’t (yet) been enough to lift the Major Trend Index out of its negative zone.
Stock Market Observations
It’s telling that the stock market rally off of the Christmas Eve lows—impressive as it was (and, for some investors, painful)—did not manage to lift the Major Trend Index beyond its neutral zone.
It’s About Money, Not Profits
The consensus focus all year has been on the boom in U.S. corporate profits.
Breakout Or Fake-Out?
The S&P 500 has fully erased its January and February losses, but there’s probably a market message in the fact that it took so long to do so.
Change In Market Character
The Major Trend Index fell into its negative zone last week and we trimmed the already below-average net equity exposure in tactical accounts by a few more points, to a current 41-42%.
The Correction That Scared No One
The setback from the January 26th market peak represents the ninth correction of 7% or more since 2009, the most ever recorded during a single cyclical bull market.
Most Likely Just A Correction
So, what happened to the January Barometer—the old analyst’s maxim that a market gain in January portends a gain for the full year?
Market Breadth Still Very Robust
Read this week's Major Trend Index.
A “Good Year” To Start The Year
The S&P 500 was up 6.4% YTD through March 3rd, a bit above its average annualized gain of 5.9% since 1926. In other words, 2017 would be a good year if the books were closed today.
MTI Extends Bullish Streak
The Major Trend Index stabilized in a moderately bullish range during the past several weeks.
Only The Shadow Knows
If the above observation from almost a century ago remains on the mark (as it has for almost a century), then both the cyclical bull market and accompanying economic expansion should remain in force during the next several months.
How Will It All End?
Last month we described ourselves as “long on equities, but light on conviction,” and that description still applies.
Rally Extension?
We’ve boosted equity exposure twice in the past several weeks, fully cognizant that it’s not a “textbook” time to do so.
Valuations: The Correction That Never Was
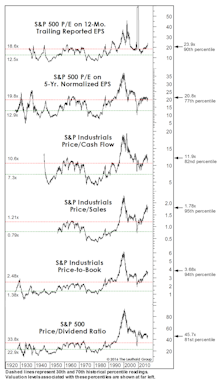
The correction failed to meaningfully “reset” any long-term valuation measures, hence, we don’t view the current environment as having much investment merit, but rather, primarily speculative appeal.
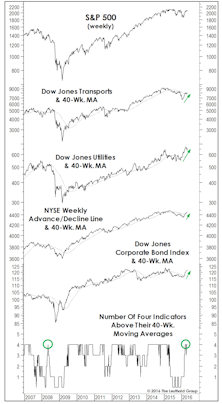
“Four On The Floor”
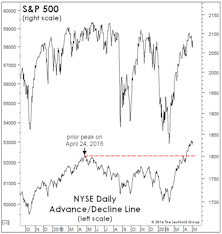
Leadership, breadth, and corporate credit all staged intermediate-term breakouts, rising above their respective 40-week moving averages. In this formation, historically, S&P 500 annualized return is +15%.
Sizing Up The Rally
While our MTI became bullish in mid-April, we can’t rule out that the rebound from February lows could be an impressive bear market rally. However, this rally sports impressive technical credentials.
MTI Now Bullish, But Doubts Linger
The Major Trend Index reverted to its bullish zone in the week ended April 15th, following almost ten months in which the work resided in either neutral or negative territory.
Improving Indicator Evidence
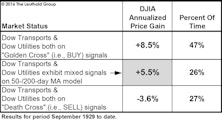
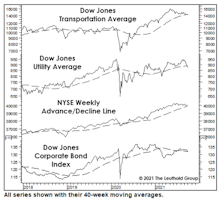
Last spring’s “Double Death Cross” in the Dow Transports and Dow Utilities had been partially reversed even before the February low, when the Dow Utilities’ 50-day moving average crossed above its 200-day moving average (thereby issuing a “Golden Cross”). The Dow Transports remain in a bear pattern based on the 50/200-day relationship, but the gap is closing fast.
Stock Market Observations
The stock market rally off the February 11th lows has been powerful enough to lift the Major Trend Index into its Neutral zone (in fact, a high-neutral ratio of 1.04), and therefore certainly deserves some level of respect.
Has The Hook Been Set?
Two months ago, we suggested a short-term bounce in oil might prove to be the fundamental “hook” that would rationalize a bear market rally. We thought a bounce to $45 might do the trick—and oil futures essentially cooperated, reaching $41.90 on March 22nd.
New Month, Old Worries...
While the S&P 500 had erased all but 2% of its August loss as of early December, Small Caps and the “average stock” had recouped only about half their correction losses. Not good.
To Play The Rally, Or Not To Play?
Question: What will you do if the Major Trend Index returns to its bullish zone?
A Bear Till Proven Otherwise
Major Trend Index remains decisively negative at 0.72. The “market action” category is the primary culprit behind this bearish tally, but we’ve also seen the Economic category deteriorate in recent months and would expect this trend to continue. This sequence is typical: Market action leads economic trends (and, we would argue, is a major cause of those trends).




.png?fit=fillmax&w=222&bg=FFFFFF)
