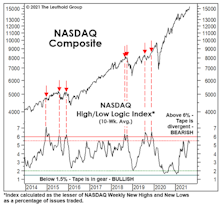
NASDAQ High/Low Logic Index
A Morsel For The Bulls
The MTI’s Technical category is still decisively negative at -3, but some of its shorter-term “counter-trend” components look intriguing for the first time in 2022’s entire decline. In particular, we’re watching the behavior of a group of indicators that performed brilliantly near the bull market highs.
History In The Making?
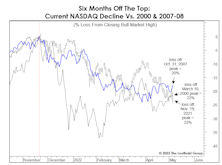
They didn’t ring a bell at the NASDAQ’s November 19th top, but shortly thereafter we wrote that the day was notable in that it was only the third time in history that a pair of our weekly Technical sub-models closed in “maximum bearish” territory at the same time.
Limping Into Wildcard Weekend With A Compound Fracture
.jpg?fit=fillmax&w=222&bg=FFFFFF)
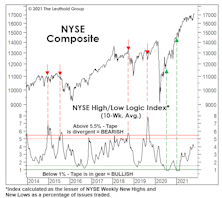
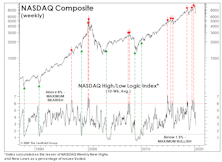
We wrote in the latest Green Book that a breadth indicator that should be more well-known than it is—the High/Low Logic Index (or HLLI)—had moved to “maximum negative” right at the cycle high in the NASDAQ Composite on November 19th. Specifically, the 10-week moving average of this indicator showed a perilous internal condition in which too many NASDAQ stocks were reaching 52-week New Highs and New Lows simultaneously. That’s the very definition of a “fractured” market, and has preceded some important NASDAQ declines. There have also been a couple of premature warnings, as in the summers of 1996 and 2019.
A Dose Of Hindsight For 2022...
Speaking ill of the NASDAQ is like taunting Tom Brady; it’s hard to remember a good outcome. Still, we must dutifully report a new finding that QQQ owners won’t like.
The State Of The “Tape,” Before The Taper
Technical types who have the luxury of avoiding the worsening valuation, inflation, and liquidity backdrop probably view today’s market as a much “safer” one than has existed for many months, now that breadth and leadership cracks have been mostly sealed up.
Reading The Short-Term Tea Leaves
The market’s August push was enough to lift four of the seven lagging bellwethers to new cycle highs. Among the three remaining laggards, only the Dow Jones Transports is still significantly below its high.
NASDAQ Natterings
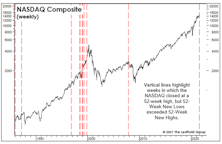
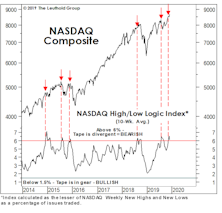
In the week ended July 23rd, the NASDAQ accomplished a rare feat by closing at a 52-week high at the same time that more of its members were pegging 52-week New Lows than New Highs. That last occurred at the exact NASDAQ high preceding the GFC collapse; there was also a timely warning ahead of the crash of 1987.
Reading The Short-Term Tea Leaves

The stock market’s technical backdrop remains pretty hard to assail, as evidenced by the current +4 reading on the revamped MTI’s Technical category. But there are a few short-term cracks that bear watching.
How To Tell When Sellers Are “Exhausted”
NASDAQ was the superstar of the bull market yet, ironically, it was a NASDAQ breadth measure that periodically signaled that all was not well beneath the market’s surface.
A Tough Tape To Read
Over the nearly two years since the stock market’s “momentum” peak in January 2018, the S&P 500 has gained less than 9%, while the Value Line Arithmetic Composite is unchanged. Mid Caps and Small Caps have made no upside progress during this period and most foreign markets are down.
A Final Warning

This Stock Market section’s unifying theme has been that of an historically two-tiered market, one in which Domestic, Large Cap, Growth, Consumer-oriented, and Low Volatility stocks have reigned supreme.
August Is No Time To Disconnect
Rather than stocks disconnecting from the economy, as some equity bears contend, we see the blue chips disconnecting from the rest of the market. The underperformance of leading groups, along with multimonth divergences in momentum, bullish sentiment, and credit spreads are all consistent with the deteriorating prospects for earnings and the economy.
Breadth: Is It Different This Time?
The granddaddy of all technical indicators—the NYSE Daily Advance/Decline Line—continues to make new highs alongside the S&P 500, suggesting the market should move to even higher (but perhaps narrower) highs well into the fall. As noted a month ago, we increasingly suspect that granddaddy may be telling a lie.
Are New Lows The Key To New Highs?

Last year’s market decline was one of the largest to have occurred without a lengthy-preceding period in which breadth narrowed and Small Caps significantly underperformed.
Perception for the Professional
March 2026 Issue

Featured Articles
Sector Navigator
March 2026 Issue
