NASDAQ
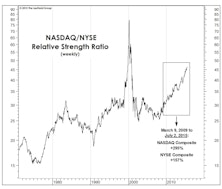
A NASDAQ Conundrum
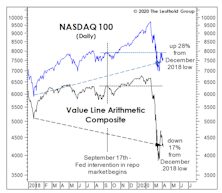
While we have an above-market weight in Technology stocks in our Select Industries portfolio, it’s doubtful that NASDAQ bulls have drawn much inspiration from these pages of late. But here’s a simple finding to potentially rectify that.
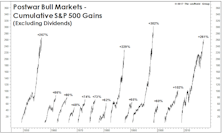
If It’s A Bull, How Does It Stack Up?
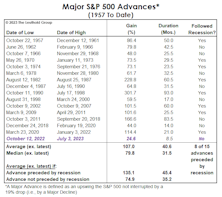
Although we can’t claim that the 2022 decline purged the economic and stock-market excesses for another multi-year bull, there’s nothing in the action of the S&P 500, itself, that exposes its upswing as fraudulent.
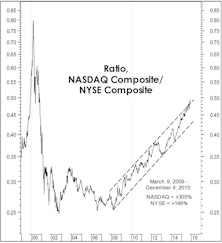
Why NASDAQ’s Gains Are A Disappointment
The run-up in Tech and the NASDAQ has been impressive, but their relative strength in recent months might be considered substandard from a “cyclically-adjusted” perspective.
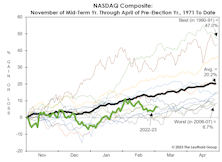
Irrationality Is Back, Right On Schedule
The hostile monetary backdrop makes recent stock market exuberance even more irrational than in early 2021. Yet, this is the middle of a seasonal window that historically boasts an elevated level of craziness: It is the year preceding a presidential election—a time when monetary and fiscal stimulus are ramped up.
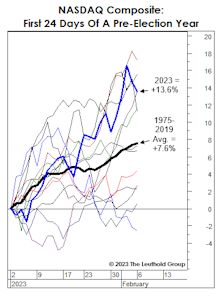
History In The Making?
They didn’t ring a bell at the NASDAQ’s November 19th top, but shortly thereafter we wrote that the day was notable in that it was only the third time in history that a pair of our weekly Technical sub-models closed in “maximum bearish” territory at the same time.
Can Santa Cap-Off A Stellar Year?
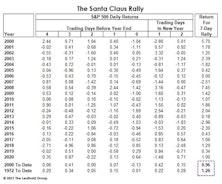
The S&P 500 is flirting with new all-time highs, and the news gets even better for followers of seasonal patterns: The Santa Claus rally has yet to officially begin!
A Religious Calendar Calls For A 2022 (Market) Sabbatical
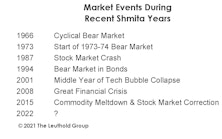
With the most speculative year in U.S. stock market history drawing to a close, we could probably all use a rest. How about a rest that lasts 12 months?
The year 2022 on the Jewish calendar is a Shmita year—historically considered to be a year of rest, or sabbatical, following six years of work. Unfortunately, markets have frequently taken this suggestion quite literally! There’s been a major financial disruption in seven of the eight Shmita years dating back to 1966:
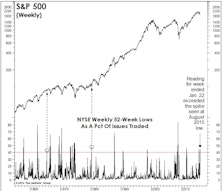
NASDAQ Natterings
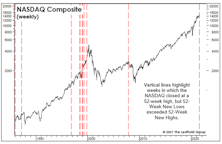
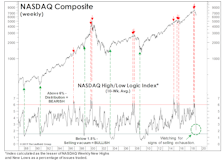
In the week ended July 23rd, the NASDAQ accomplished a rare feat by closing at a 52-week high at the same time that more of its members were pegging 52-week New Lows than New Highs. That last occurred at the exact NASDAQ high preceding the GFC collapse; there was also a timely warning ahead of the crash of 1987.
Is “NASDAQ Fever” Peaking?
Even casual market observers have begun to marvel at the NASDAQ’s ability to defy the rest of the stock market, and the “U.S. Exceptionalism Index” continues to go parabolic.
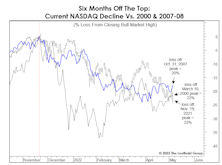
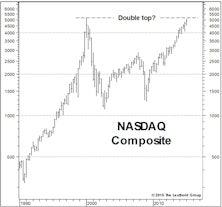
NASDAQ Goes “Parabolic?”
From now ’til eternity, bullish market pundits will always be able to argue that the global spread of the coronavirus “caused” the current global recession and bear market. While the pandemic was certainly the final catalyst, these pages had been detailing the emerging cracks for over a year.
Watching For An Internal Washout
Having monitored market internals for warning signs for longer than we care to admit, it’s refreshing to turn around and watch many of the same signals for… wait for it... BUY signals!
Technical Difficulties
Traditional breadth measures have yet to show end-of-cycle thinning of the ranks, but some secondary measures suggest that process may be underway.
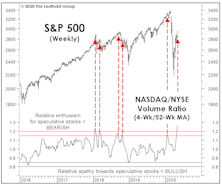
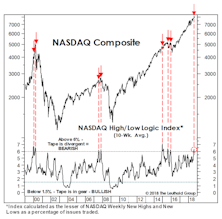
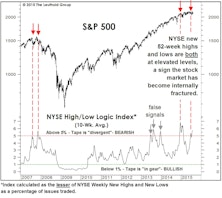
Why So Many Lows Near A New High?
.jpg?fit=fillmax&w=222&bg=FFFFFF)
The S&P 500 has closed within a half percent of an all-time high three times this week, and the S&P 1500 Composite did make such a high on Tuesday, August 21st...
Stock Market Observations
After a two-month lull, stock market momentum reasserted itself in May bringing our summer S&P 500 target of 2,600 back into focus… Meanwhile, we’ve fielded several media calls about the “FANG” stocks’ large contribution to some YTD returns—but that doesn’t diminish the new highs being made elsewhere by disparate groups… NYSE Weekly A/D Line and New Highs/Lows figures also suggest the stock market isn’t yet top-heavy enough to tip over.
A “Measured” Melt-Up
The stock market “melt up” scenario is underway but has proven less broad than we expected. Just as in the late-1990s, Technology and NASDAQ are the main subjects of investor adulation.
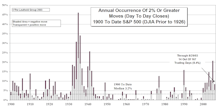
NYSE “New Lows” Figures Point To “Lower Lows”…
At the August and late January S&P 500 lows, both the Daily and Weekly NYSE New Lows figures exceeded 40% of Issues Traded —a degree of downside thrust rarely seen outside of bear markets.
The NYSE: A Timely Insider Sale
We tracked the “legal” insider actions of NYSE specialists for many years, until a crackdown on that business model early last decade rendered our old data sets virtually irrelevant.
Too Many Highs, Too Many Lows
We’ve detailed the growing degree of stock market bifurcation, but the problem for would-be bears is that such bifurcation can reach astonishing levels (witness 1999-2000) before the market is set to peak out.
NASDAQ Apathy?
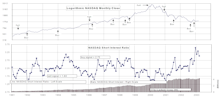
The NASDAQ has solidified its grip on 12-month leadership, rising 11% versus a 4% loss in the NYSE Composite. A surprising feature of NASDAQ’s relative strength dominance is that is has not been accompanied by a rise in relative volume.
Spring Fever?
We remain reluctant stock market bulls, with our disciplines supporting net equity exposure (targeting 55%) that “feels” too high based purely on instinct. We think our stay in the overcrowded bull camp will be short-lived.
NASDAQ Now, Financials Next?
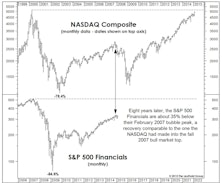
We wouldn't be surprised if the S&P 500 Financials require a recovery period just as long as NASDAQ's.
Major Trend Moves To Neutral, But Not All Hope For The Bulls Is Lost
Deteriorating Technicals drove the move to Neutral, but a new positive reading in the Attitudinal category gives some hope to the bulls.
Nothing But Clear Blue Skies Ahead? We're Not So Sure
With no obvious technical resistance left for the U.S. stock market, we’re skeptical of the “long cycle” view, primarily based on valuations and “provincial” data points.
2011 Volatility Summary: S&P 500 And NASDAQ
Even though the major indices ended the year flat for the most part, volatility measures paint a different story.
NASDAQ Ten Year ACR Now At An All-Time Low...And Heading Lower
Demoralizing long term returns factor into why the investing public has avoided the U.S. stock market during the last several years — even during the bull market.
Some Erosion - But Not A Collapse - In The Wall Of Worry
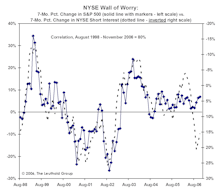
The surprising restraint in investor enthusiasm has been a key pillar behind our bullish case for the stock market.
Debunking One Myth Of The Buy And Hold Rationale
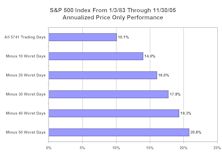
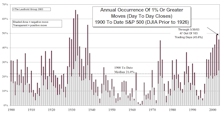
Debunking one myth of buy and hold rationale. Showing how stock market returns change if investors avoid the best and worst performing stock market days. Essentially, anything can be proven with statistics.
NASDAQ vs. S&P Market Weights
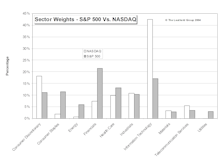
Comparing the sector weights between the NASDAQ and the S&P 500.
Is The NASDAQ Recovery Over?
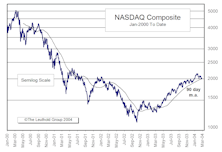
NASDAQ was only index to decline in February. Some are wondering if the rally is over for the NASDAQ. This month’s “Of Special Interest” looks at past NASDAQ recoveries.
Volatility Update…..Both Indexes Show Lower Volatility In 2003
Volatility continues to fade in the S&P but remains volatile on a historical basis.
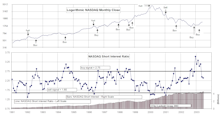
NASDAQ & NYSE Short Interest
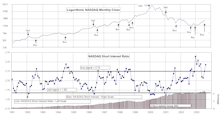
New NASDAQ buy signal as volume declines. NYSE short interest ratio increases again as volume and short interest both decline.
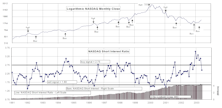
NASDAQ & NYSE Short Interest
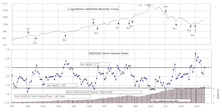
Both the NYSE and NASDAQ short interest ratios saw increases in July.
Volatility Update…..Both Indexes Show Lower Volatility In 2003
In 2003, the NASDAQ has not been as volatile as in recent years, but is still more volatile than the S&P 500.
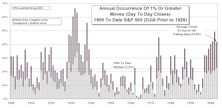
“Sell In May And Go Away”
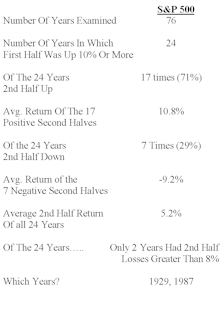
It looks like a strong first half can still lead to a good second half, unless the first half was really good.
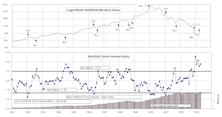
NASDAQ & NYSE Short Interest
While the NASDAQ short interest ratio continued to decline, the NYSE ratio increased in June.
Volatility Update…..NASDAQ Still More Volatile Than The S&P 500
In 2003, the NASDAQ has not been as volatile as in recent years, but is still more volatile than the S&P 500.
NASDAQ & NYSE Short Interest
Both indicators drop to neutral in May.
NASDAQ & NYSE Short Interest
Both the NASDAQ and NYSE short interest ratios increased in April.
NASDAQ & NYSE Short Interest
Both ratios still bullish.
Catching Up To The Guy Who Sold At The Market Top

Given various assumed compound rates of return, how long will it take for the investor who remained in stocks to catch the investor who shifted to T-bills at the top?
Perception for the Professional
March 2026 Issue

Featured Articles
Sector Navigator
March 2026 Issue
