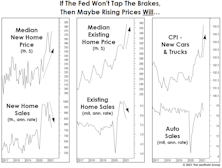
NOPE Index
No Longer An Emphatic “NOPE”
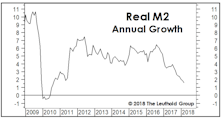
While the MTI’s Cyclical category remains hostile at -3, we’ve observed steady improvement in its leading inflation components. Especially notable is the reversal in the NOPE Index (ISM New Orders Minus Price Index).
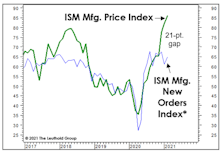
Signs Of “Demand Destruction?”
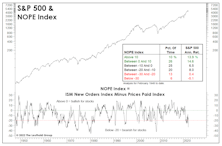
They are simple measures, but our “NOPE” Indexes capture (as well as anything) the escalating inflation squeeze on businesses and consumers. To recap, the NOPE is the spread between the ISM New Orders Index and the Price Index, which can be calculated for both the Manufacturing and Services sectors.
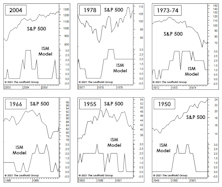
Special Study: Should You Buy The Dip? Some Statistical Considerations…
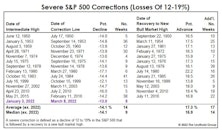
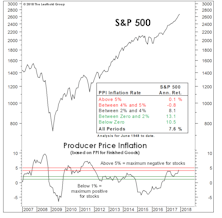
The correction in the S&P 500 since its high on January 3rd qualifies as a “severe” correction, which we define as a decline of at least -12% based on daily closing prices. What are the odds that it becomes a “major” decline*—in which the loss exceeds -19%?
In Section I, we review the history of severe corrections since 1950. In Section II, those corrections are analyzed in the context of the economic cycle, consumer sentiment, and other underlying factors—ones that might help us determine if today’s stock-market weakness is “buyable.”
Speed Trap Ahead?
In San Francisco, thefts of less than $950 have been decriminalized, while in Minneapolis, police are so beleaguered that car thefts not involving injury are ignored. Is it any wonder that the economy felt free to violate its usual stock market “speed limits” throughout much of 2021?
Manufacturing: More Citations For Speeding
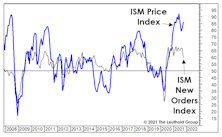
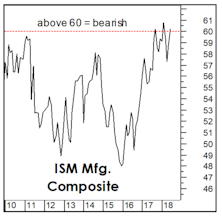
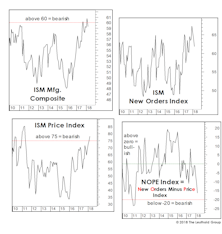
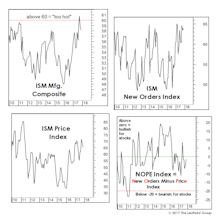
It is much easier to predict inflation, itself, than to predict when investors will become traumatized by it. Some of the most helpful measures for the latter task come from the ISM Manufacturing Report. October’s readings saw three key measures above the statistical “speed limits” we calculated years ago.
Are High Prices A Form Of “Tightening?”
It’s certain that today’s cyclical bout of inflation will prove “transitory,” if only because the word itself is practically meaningless. Our time on earth will also prove transitory, and so too will the current stock market mania—to the shock of most of the nearly 20 million “investors” on the Robinhood platform.
Inflation: Nothing To Fear But The “Lack Of Fear”
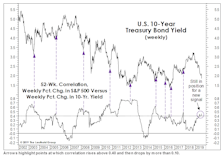
The refusal of the bond market to acknowledge the worsening inflation readings seems to have strengthened the consensus view that any inflation trouble will be “transitory.” Do bonds still know best when there’s a systematic, price-insensitive buyer hoovering up $120 billion of them per month?
Inflation Watch
April ISM readings, both for Manufacturing and Services, were hot across the board. That’s good news for a still-recovering Main Street, but it manifested in ways that have frequently caused problems for a famous Street located in Lower Manhattan.
NOPE And NOPE!
The calendar would say the U.S. economic recovery and bull market are very young, yet there’s an astounding array of “late-cycle” activity occurring on both Main Street and Wall Street. In the manufacturing economy, bottlenecks have reached levels that have historically been troublesome for stocks.
Early-Cycle “Overheat?”
Equities continue to benefit from an odd combination of faith and doubt in the Federal Reserve: Faith that the “Fed put” under financial markets is struck closer to the price of the “underlying” than ever before, and doubt that limitless liquidity will trigger a dangerous rise in consumer prices. In all fairness, this glass half full assessment is hardly a theoretical one, but one based on years of empirical evidence.
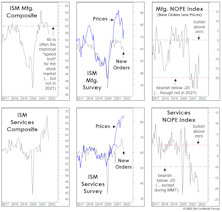
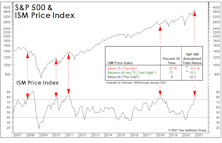
The NOPE Index Says “Nope!”
The most valuable gauge we construct from the ISM Manufacturing and ISM Non-Manufacturing reports sunk into bear territory with the April update, signifying a serious margin squeeze has hit the service sector.
Waiting For The Stimulus To Trickle Down...
Last year the Federal Reserve dumped historic stimulus onto a full-employment economy and an already richly-valued stock market. The stock market obviously loved it.
Last Bastion Breaking Down?
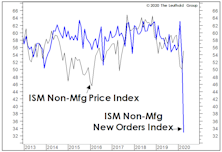
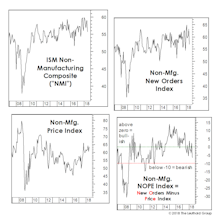
We’ve been expecting weakness in the manufacturing sector to spread to the service economy, but were not prepared for the nearly four-point drop in the latest ISM Non-Manufacturing Composite. We don’t want to overplay a single monthly reading from an historically volatile report, but the Non-Manufacturing Price Index spiked despite the drop in New Orders.
ISM Shows This Is A Different Kind Of Cycle
The manufacturing economy has thrown us a deflationary curve in 2019: The Price Index broke down in advance of New Orders, a reversal of the textbook recession/recovery sequence between these two measures.
Odds & Ends
Here are some brief follow-up notes on topics covered in recent months’ Green Books.
Deflation And Deception
.jpg?fit=fillmax&w=222&bg=FFFFFF)
We think the current economic cycle is more likely to end in a deflationary bust than with a bout of late-cycle “overheating,” and analysts and investors should recognize that such a cycle ending could be especially difficult to detect.
Economic Stocking Stuffers
While the monetary and liquidity backdrop has deteriorated all year, the shorter-term economic evidence has remained mixed.
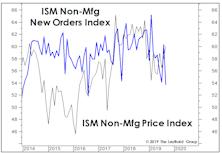
Watching Prices And New Orders
.jpg?fit=fillmax&w=222&bg=FFFFFF)
Trying to monitor the dozen or so regional purchasing-managers’ surveys released prior to the monthly national report invites a perpetual case of whiplash...
Service Sector Slowdown?
While service industries have minimal direct exposure to trade disputes, they will begin to suffer from knock-on effects if the tensions continue to escalate.
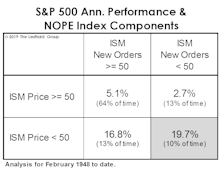
A New ISM “Composite”
Over the past year, we’ve highlighted three mechanical market models based solely on components of the ISM monthly manufacturing report (Charts 1-3).
Earnings Soar While Liquidity Circles The Drain
Question: How can you be cautious on the stock market with recent earnings results so spectacular?
A Fleeting Glimpse Of Goldilocks?
The first several years of this recovery badly underperformed forecasts, with partial blame going to a pair of deflationary shocks (the European debt crisis and oil price collapse).
Pressure Points?
The first few trading days of the new year have been a seamless extension of 2017—a low-volatility, “measured” market melt-up.
The ISM: Good News Is Still Good News
November’s report might have been lifted verbatim from the Goldilocks playbook, with the reading very strong but below the 60 level that we’ve statistically shown to be a threshold where “good news becomes bad news” for the stock market.
Commodities: How Strong Is Too Strong?
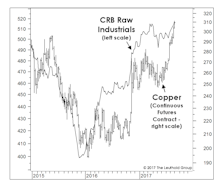
While the bond market doesn’t believe it, the past couple of months leave no doubt that the U.S. industrial economy has recovered from the energy-related slump of 2015-2016.
Need More Reasons To Buy?
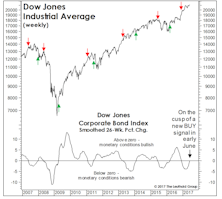
When it rains, it pours. As if the market’s broad new highs of early June aren’t enough, here’s a pair of sub-models from the MTI’s Economic category that are set to turn bullish.
Stock Market Observations
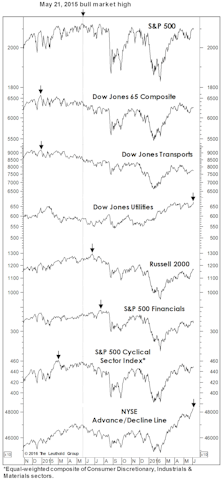
Commentators now label this cyclical advance the “seven-year bull market,” but that won’t be semantically true until the S&P 500 closes above its May 2015 peak of 2130.82.
Perception for the Professional
March 2026 Issue

Featured Articles
Sector Navigator
March 2026 Issue
