Normalized EPS
Premature Aging?
If today’s stock market is indeed a new bull, its vital signs advise that it is more in need of a coffin than a cradle. Monetary policies, both in terms of rate hikes and the inverted curve, have never been more hostile at this stage of a major stock market upswing.
Another Chance To “Buy High”
Despite this year’s massive underperformance by the Equal Weighted S&P 500, the median stock doesn’t appear substantially more attractive than the cap-weighted index. Three of five valuation measures are now back in the top decile of readings, which we’d consider pricey in any monetary or economic backdrop.
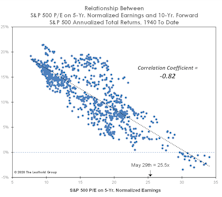
A Rear-View Peek At The Future
Question: Some tactical managers provide long-term forecasts for stock market total returns (7-10 years or longer). Do you publish such estimates?
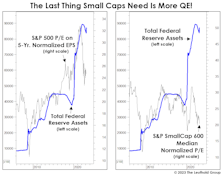
QE Fuels Inequality—Even Among Stocks
We don’t know enough about banking-system mechanics to conclude if the Fed’s balance-sheet increase associated with March’s bank bailout constitutes a new round of QE. But if it is, we’re skeptical equity investors should celebrate it. In fact, those running Small-Cap portfolios should probably fear it!
Valuations: What Bear Market?
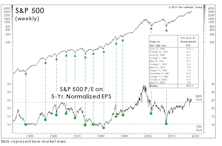
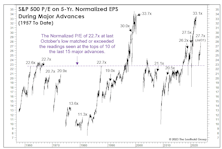
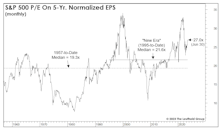
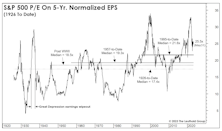
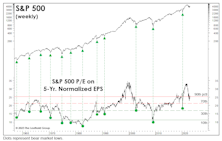
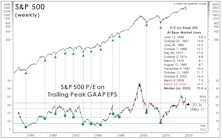
If the October S&P 500 low holds, the normalized P/E ratio of 22.7x on that date will signify the priciest bear market bottom in history; in fact, it is exactly the same level reached as at the August-1987 bull market high. Since October, the normalized P/E multiple has grown to 25.5x—higher than all but three previous bull market peaks.
“Recessionary” Valuations?
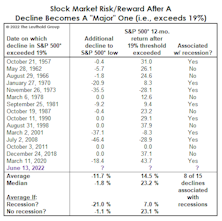
The bear was a mere cub back in March when we examined the historical record of buying S&P 500 dips in the -10% to -12% range. “Blindly” buying them turned out to have mediocre returns, but we illustrated that the positions of various business-cycle indicators could help one determine whether or not catching the proverbial “falling knife” was warranted.
Bubble Or Not? Two Valuation Takes
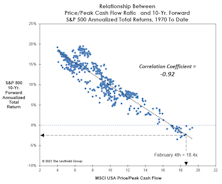
In early 2018, we thought the market was expensive, but certainly not a bubble. Today, the trouble is not just high P/E multiples, but the sustainability of the “E” itself—with profit margins nearly 20% higher than ever before. Whether one believes U.S. Large Caps are engulfed in a bubble or not, we have a P/E ratio for you.
“Into The Weeds” With Normalized EPS
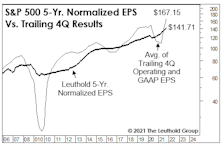
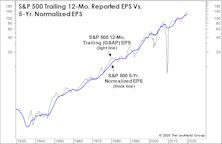
The environment where massively above-trend federal outlays have generated massively above-trend readings in both current and projected S&P 500 EPS, the idea of normalizing EPS over a period as long as five years might seem hopelessly out of touch. But it’s during times of extraordinary conditions—both good and bad—that render this work especially valuable.
Music For The “Mania”
At some point during the June/July streak of seven-consecutive S&P 500 daily-closing highs, an album from 1980 popped into our heads: Nothin’ Matters And What If It Did—released when John Mellencamp was still known as John Cougar. It brought to mind some “nothin’s” that seem not to matter.
We’re The Government And We’re Here To Help
Our trusted civil servants must have found a list of our old Economic/Interest Rates/Inflation components and began to “discontinue” those once invaluable to us and other Fed watchers. It’s a hindrance, but we still have the one that is most correlated to stock prices and it’s free: The ever-expanding balance sheet.
Normalize This!
The sell-side is at it again, publishing a one-year ahead “Adjusted” EPS figure for the S&P 500 that is unlikely to be achieved—and then affixing P/E multiples seen near an historic market peak to “capitalize” on those unlikely earnings.
“Normalizing” For The Earnings Collapse
Stocks (and more specifically, U.S. blue chips) did not fully (nor even approximately) discount the economic calamity. The result is that, in just over two months, the “baby bull”—if that’s what it is—has achieved what took his legendary predecessor more than eight years to accomplish: Top 25x on our Normalized P/E.
Calculate The Next Low... With The Last Peak?
How does one value a stock market in which 12-month forward EPS estimates show their widest dispersion in history? A good start might be with methods we use when forward estimates show practically no dispersion (like three months ago). In either case, we place little weight on such estimates; each revision usually has only marginal impact on our 5-Year Normalized EPS.
Time To Revisit “Why We Normalize Earnings”
With an economic calamity and the Easter season upon us, we thought this would be a great time to resurrect our “Why We Normalize Earnings” vignette. Long time readers will recognize this as a staple from Green Books’ past.
Valuations: An Updated “Modern” Take
An occasional critique of our valuation work is that we consider “too much” market history to form a judgment as to what constitutes “high” or “low.” This type of feedback declined during and after the financial crisis (when historic valuation thresholds were temporarily revisited), but it has become more pointed as the U.S. market has soared to new highs.
A “Best Case” Bear Scenario?
We intentionally curtailed our discussion of stock market valuations the last few months to allow the “dead horse” to recover from the thrashings administered in recent years. Now we’re rested, refreshed, and ready to deliver a few more lashes.
Small Cap Valuation Check
We don’t have a strong capitalization-bet recommendation, other than to remind readers that Small Caps have been especially responsive to the favorable seasonal window that began November 1st (and which extends through April 30th).
Revisiting The Y2K Highs
Bobby Knight thought coaching would be perfect “if it weren’t for those damned games.”
Could It Be A “Two-Fer?”
The milestones achieved by the current cyclical bull market have been so numerous that we hope you’ll forgive us for missing one back in May.
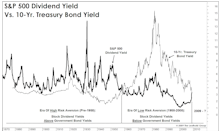
Stocks Versus Bonds: A Lonnngggg-Term View
On a 50-year view, stocks do indeed look cheap relative to bonds. But the inclusion of 90 earlier years of data muddies the message.
Has The Fed Already Hit Stocks?
One never appreciates what he or she has until it’s gone. In our case, during the many years it was freely available, we failed to appreciate the zero interest rate. Now that it’s gone, we already feel pressured to join a game where we (and very few others) have any edge: Fed-watching. Our real edge is that we recognize this.
A Semi-Annual Checkup!
Call off the mortician, and bring on the pediatrician for the bull market’s 7 1/2-year checkup this month.
Sizing Up Small Caps
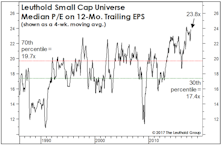
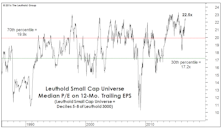
While the most inflated domestic-valuation readings are found in the Large Cap realm, the market rebound has driven the median 12-month trailing P/E in our Small Cap universe to 22.5x (Chart 1)—less than a point away from the June 2015 all-time high of 23.3x.
Draghi: Losing The Battle And The War
If the current global bear market manages to shake investors’ blind faith in central bankers, this decline might actually accomplish something in the long term. But breaking that faith will take awhile.
Foreign Stocks: The Value Trap Persists
Foreign stocks’ perpetual underperformance has opened up a valuation gap that should look extremely appealing to anyone with a horizon of more than two years. But proceed with caution.
A Comprehensive Look At The Emerging Markets: Diagnosis And Prognosis
We examine Emerging Markets from both the top-down and bottom-up perspectives as we try to identify where to move and what to expect. We check in on two successful EM thematic group ideas as well.
A Peak At The Rear-View Mirror!
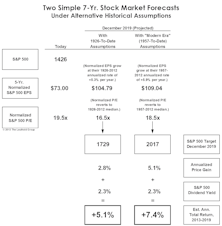
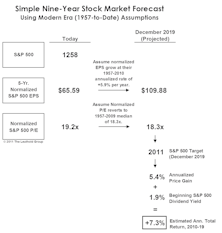
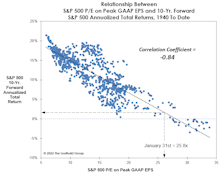
We’ve lately made it a January tradition to publish a “Rear View Mirror” forecast for S&P 500 returns out to the end of this decade.
Valuations: The Good And The Bad
S&P Normalized valuations are already in the zone that have defined many important bull market tops.
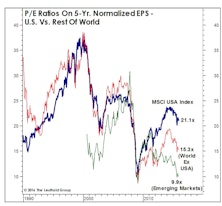
Global Valuations: Reverting To The Trough
From our perspective as disciples of Normalized EPS, the entire bull market to date has come from P/E expansion. However, that stands to change as global Normalized EPS are again on the rise.
2011 In 2019?
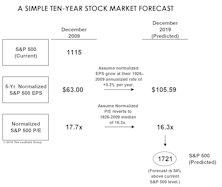
Year-ahead stock market forecasts are now in hot demand, but of course are notoriously off the mark most years. Very long term forecasts (say, out to the end of the decade) are in virtually no demand, but are considerably easier to get close to the mark for those armed with the right tools.
Going (More) Global
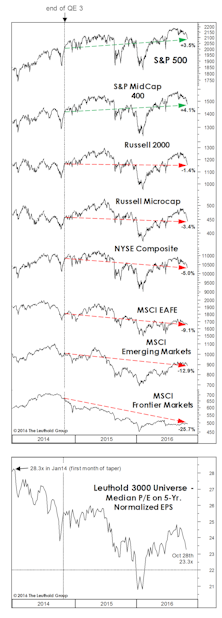
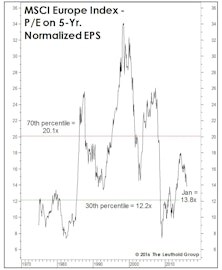
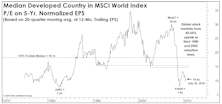
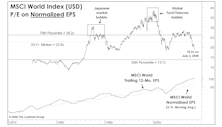
MSCI Index very undervalued, as the recovery off the March 2009 lows has left valuations still near prior bear market lows. Relative to foreign markets, the U.S. looks expensive. This is why we continue to maintain a healthy exposure to foreign stocks…especially emerging markets.
U.S. Stocks: What If The New Decade Is “Normal”?
While most are content to make annual predictions at this time, leave it to Doug Ramsey to bite off an even bigger piece…predicting the next DECADE.
Valuation Constraints?
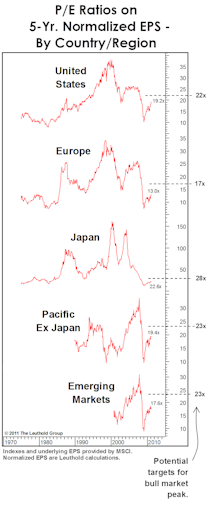
There is a potential valuation ceiling confronting U.S. stocks. 2002 S&P valuation lows may be the point that this cyclical bull market tops out.
Estimating The Upside
Given the very long-term ebb and flow of market valuations, it is hard to believe that—with old valuation norms finally and decisively violated to the downside—the market will spring back to anything like the valuations seen in the middle of this decade.
Materials: From First To Worst
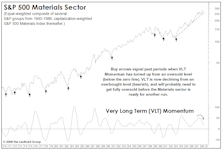
Materials sector has fallen fast and hard in our GS Score rankings and is now the worst rated. Still see further downside based on valuations and technical factors. No, we do not think the underlying commodities can outperform while the stocks fall.
The Major Trend Index...Gone Global
Comparing and contrasting our traditional Major Trend Index and the Global Major Trend Index. Both are now Neutral, but the Global version is showing better valuations and worse technical scores.
Interest Rates And Stock Valuations: A Broken Linkage?
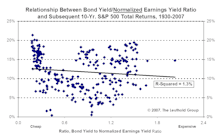
A look at the relationship between bond and stock yields as justification for today’s expectations of a continued bull market and for the current LBO craze. No evidence that Fed-type valuation models help forecast future market returns.
Valuations…..Most Bear Markets End Around Median P/E Levels
Earnings are rebounding strongly. S&P operating earnings estimates are up 21% from 2001 to 2002, and up 23% from 2002 and 2003. Severe cost cutting may not be fully factored into analyst estimates. Look for upside earning surprise.

.jpg?fit=fillmax&w=222&bg=FFFFFF)
