Precious Metals
GS Scores: Industrial Metals Stocks Heating Up
While the Materials sector overall still isn’t looking stellar based on our work, we think with the Metals theme heating up, it’s a trend worth watching.
Steel Sinks To The Bottom This Week
Real Estate Investment Trusts and Precious Metals were this week's best groups. Regional Banks and Steel were this week's worst groups.
Auto Parts & Equipment Is A Wreck This Week
Oil & Gas Exploration & Production and Precious Metals were this week's best groups. Regional Banks and Auto Parts & Equipment were this week's worst groups.
Precious Metals Lead This Week
Regional Banks and Health Care Facilities were this week's worst groups. Beverages and Precious Metals were this week's best groups.
Precious Metals Leads This Week
Biotechnology and Precious Metals are this week's best groups. Restaurants and Department Stores were this week's worst groups.
Precious Metals Stay On Top
Biotechnology and Precious Metals were this week's best groups. Managed Health Care and Oil & Gas Refining & Marketing were this week's worst groups.
Precious Metals Regain Their Luster
Oil & Gas Equipment & Services and Precious Metals were this week's best groups. Multi-Utilities and Human Res. & Employment Services were this week's worst groups.
Precious Metals Shine This Week
Tech Hw Stor & Periph and Precious Metals were this week's best groups. Internet Retail and Home Entertainment Software were this week's worst groups.
The Lesser Of Two Evils?
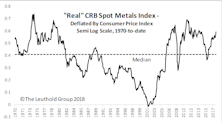
Last month we wrote that we had no interest in playing even an “oversold bounce” in the precious metals, and our view hasn’t changed. Crude oil has already fallen to its long-term, inflation-adjusted mean; if gold does the same, its downside extends below 700.
Industry Groups To Avoid
Currently, the Unattractive range of our GS Scores is characterized by two themes, commodity-oriented groups and high dividend groups.
Core & Global Portfolios Equity Exposure Maintained In December
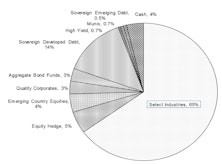
The Major Trend Index remains positive and net exposure in both portfolios is 64%. For all of 2013, our average net equity exposure was 60% in each portfolio.
Sector Performance – Finding Discrepancies
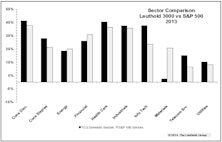
Our Tech sector outpaced the S&P 500 Tech sector by 1400 bps and our Materials sector lagged the S&P 500 Materials by 2300 bps. Here’s why…
The Dreams & Nightmares Of 2013
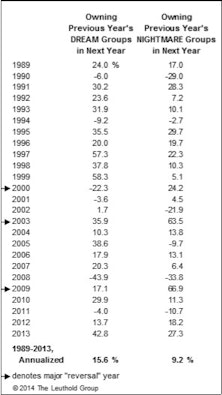
For 25 years we’ve tracked hypothetical industry group portfolios comprised of the previous year’s “Dreams” (20 best performers) and “Nightmares” (20 worst performers).
Core & Global Portfolios Equity Exposure Raised Slightly As Hedge Reduced
The Major Trend Index remains positive and, as expected, our temporary ETF hedge was lifted. Our net exposure in both portfolios is now 64%-65%.
Core & Global Portfolios Equity Exposure Trimmed Slightly To 60%
The Major Trend Index remains positive, but we reduced our target exposure from 62% to 60% using a short ETF as we believe this position will be temporary in nature.
Record Performance Correlations Continue
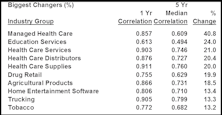
Industry groups and stocks continue to set records with performance correlations. Defensive groups have seen the largest percentage gain to current correlations relative to the last five years. There truly has been no place to hide in this market.
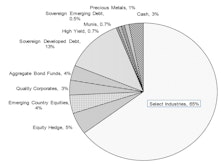
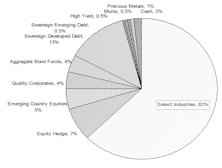
Platinum and Gold

This issue our conventional asset allocation model is shifting part of its catastrophe insurance gold holding into platinum. We are becoming increasingly concerned about a gold glut in the next decade, while quantum leaps in platinum production are not in prospect.
Perception for the Professional
March 2026 Issue

Featured Articles
Sector Navigator
March 2026 Issue
