Price/Peak Cash Flow
Normalizing The Abnormal?
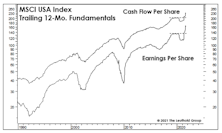
In recent years, we’ve supplemented our longstanding normalized earnings technique with the simpler method of referencing any past peak in EPS (or, for that matter, trailing peaks in other corporate fundamentals, like cash flow and sales per share).
Valuations And The Earnings Recovery
Analysts at Standard & Poor’s will soon confirm what’s been known for several months: The earnings downturn associated with the COVID recession was the shallowest and shortest of any recession-related EPS decline.
The Earnings Recession Is History
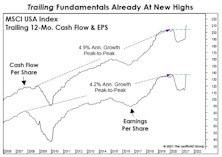
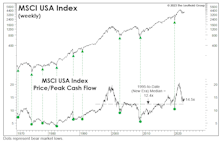
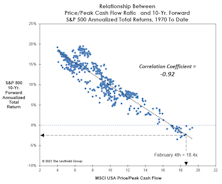
We expected that the earnings recovery from the shortest-ever U.S. recession would be the fastest on record. Trailing figures for the MSCI USA Index now confirm this: Trailing EPS and Cash Flow Per Share have surged to new highs only 14 months after their March 2020 peaks.
EAFE And EM: Long Past Their “Peaks?”

We applied the “Peak Cash Flow” valuation methodology to the EAFE and MSCI Emerging Markets Index and found them both priced at only about one-half of today’s MSCI U.S. multiple. However, the ratios are already above anything achieved during the 2009-2020 global bull market.
A Pricey Alternative To The S&P 500?
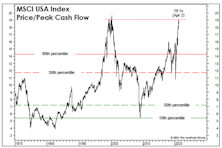
This month we focus on the valuations of the MSCI USA Index—which is nearly identical to the S&P 500. This is worth following mainly because the folks at MSCI are kind enough to provide us with much longer-term histories of Cash Flow and Book Value Per Share.
Normalize This!
The sell-side is at it again, publishing a one-year ahead “Adjusted” EPS figure for the S&P 500 that is unlikely to be achieved—and then affixing P/E multiples seen near an historic market peak to “capitalize” on those unlikely earnings.
Perception for the Professional
March 2026 Issue

Featured Articles
Sector Navigator
April 2026 Issue
