Topping Pattern
A New Take On Small Cap Valuations
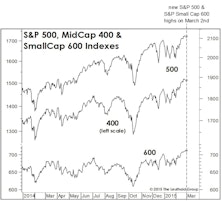
For valuation work, we’ve traditionally favored the 1,200 company Leuthold Small Cap universe over the S&P SmallCap 600 because we get almost a full additional decade of perspective. But figures for the latter shed extra light on just how significant the revaluation in Small Caps has been.
A Short-Term S&P Top?
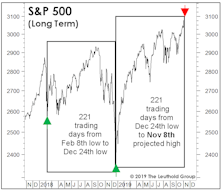
The short-term path for equities “looks” clearer than at any point in 2019, with economic data having stabilized a bit in the last few weeks, the Fed having cut rates again and resumed balance sheet purchases, and some type of trade deal finally looking more tangible than a 2:00 a.m. Tweet.
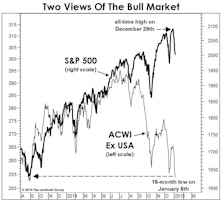
Portraits Of An Out-Of-Sync Market
We suggested many years ago that the final top to this historic bull market would be a long and complicated process rather than a clean and singular event.
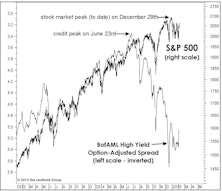
Stock Market Observations
The tops of 1990, 2000, and 2007 were all better “telegraphed” by the action of the market itself, than the September 2018 peak, but secondary measures of market internals suggested all summer that the internal trend was in fact deteriorating—and so did the action in low-grade corporate bonds.
Goldilocks, Meet The Three Bears
.jpg?fit=fillmax&w=222&bg=FFFFFF)
During the stock market’s protracted retracement of its January/February decline, we speculated a few times that the final outcome might look similar to the bull market tops of 1990, 2000, and 2007.
Tracking The Stock Market Top
While the sequence of index peaks traced out YTD is not exactly a textbook one, the market’s internal diffusion is comparable to that seen at many major tops, including 2000 and 2007.
“Top In” Or “Topping Out?”
The stock market rally has carried far enough to flip some of our trend-following work bullish, lifting the Major Trend Index to a low-neutral reading. The improvement prompted an increase in asset allocation portfolios’ net equity exposure to 42% (up from 36% previously).
The Bear Case: "Before And After"
August Was No Anomaly
A Page For The Bulls
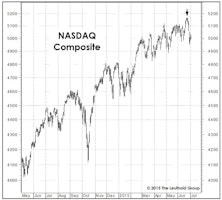
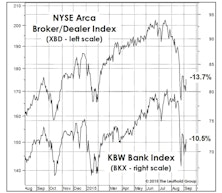
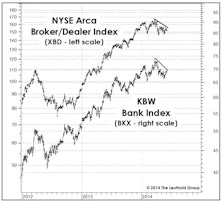
One could conceivably argue the market is still “cohesive” enough to hold together for awhile longer. June 23rd saw closing bull market highs in the NASDAQ, Mid Caps, Small Caps (both the S&P 600 and Russell 2000), and the critical KBW Bank and NYSE Arca Broker/Dealer Indexes.
Leadership: Winning Begets Winning
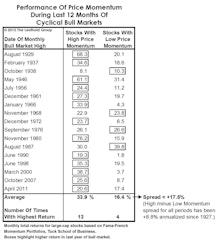
Many assume that stocks and industries exhibiting high price momentum suffer disproportionately during the eventual bear market. Surprisingly, the high momentum stock portfolio has suffered an average bear market loss that’s about a quarter less than that of the low momentum portfolio.
Another Retrospective On The Bull…
Up front, we need to remind readers that the Major Trend Index is bullish at 1.08, and our tactical funds remain well-exposed to equities with net exposure of 60-61% (versus a range of between 30% minimum up to a maximum of 70%). That being said, we’re focused on the likelihood of a major defensive portfolio move in the near future, which probably comes as no surprise to Green Book readers (...what with us publishing a prepackaged obituary for the bull market just a month ago).
Bullish, But Still Worried
Our longer-term bear market forecast and a temporarily positive stock market stance aren’t mutually exclusive.
Margin Debt Revisited
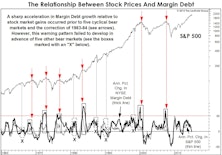
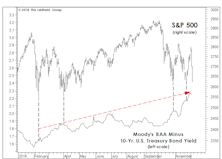
Stock market Margin Debt enjoyed a brief phase of notoriety when it eclipsed its 2007 high just over a year ago, then it retreated into obscurity. Now it may finally be telling us something.
Losing Our Voice
In a cyclical bull market as long and strong as the current one, it’s certainly possible the topping process will be proportionally lengthy and deceptive.
Canary In The Coal Mine?
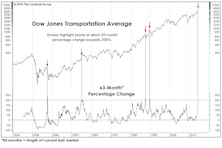
The S&P 500 made a cycle high on December 29th, and in early February mounted another assault on that level. Ignoring valuations, the economy, Europe, etc. (not necessarily our recommendation), the most bullish observations we can make about the stock market are: (1) its peak is still recent; and (2) the S&P 500 had significant company at that peak—including the Transportation stocks, Utilities, Russell 2000, S&P 500 Financials, and even the NYSE Daily Advance/Decline. All in all, this action is broad enough that a final top shouldn’t be imminent.
Topping Out… But Patience Required
Weight of the evidence suggests the bull market is in a broad topping process, likely begun in late-July. The duration, however, may be proportionate to the tremendous five-plus year upswing that preceded it.
“Overbought” Can Be Good Or Bad
The notion of “overbought” and “oversold” markets might be the costliest concepts ever developed by stock market technicians. The very words imply some sort of excessive condition that’s prone to naturally self-correct.
Transports Still Leading - Market Top Not Imminent
While stock market action YTD has not been quite as “uniform,” the hallmarks of an imminent bull market top are simply not present. The bullish portents apply to intermediate term results, however, they cannot rule out any short-term setbacks (which can appear with no tip-off from breadth or leadership measures).
Perception for the Professional
June 2026 Issue

Featured Articles
Sector Navigator
June 2026 Issue
