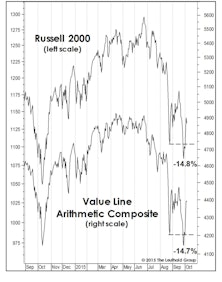
Value Line Arithmetic Average
Charts Are In The Eye Of The Beholder
After last year’s 30% S&P 500 gain, many strategists are now suggesting that the real melt-up still lies ahead. We think a melt-up has already occurred, and the bulk of it has been booked.
More Extreme Than 1999?
We noted that the December 2018 stock market low was the second most expensive in history, second only to that of October 1998. Similarities between 2019 market action and the 1998-99 rebound remain eerie. Something isn’t right, and it’s not bullish.
Here’s One Reason Sentiment Is So Subdued...
.jpg?fit=fillmax&w=222&bg=FFFFFF)
Market bulls remain mystified by the lack of enthusiasm for stocks given the proximity of U.S. indexes to all-time highs. They view this relative indifference as a contrarian positive—the “wall of worry” argument.
Divergence, Danger, And Delusion
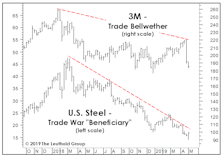
The U.S. economy and blue chips have shrugged off the risk of the worst trade war since 1930’s Smoot-Hawley Act, while comparatively few stocks on either the NASDAQ or the NYSE have broken out to 52-week highs. There’s also the troubling talk of the Fed having tamed “the cycle.” Should investors bet on a potentially wild (but narrower) final melt-up over the next 6-12 months? We don’t like the odds.
Charts: Beware Of Myopia
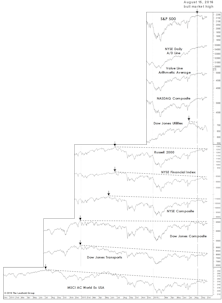
Despite a two-month stall in the blue chips, the breadth and momentum behind the market’s rally off mid-February lows remain hard to deny.
Stock Market Observations
The August market break did not emerge from out of the blue. The foundation for the bear case was put in place many months before those four ugly days in late August.
Perception for the Professional
March 2026 Issue

Featured Articles
Sector Navigator
March 2026 Issue
