Special Reports
Time to Sell Stocks Our Diffusion Index Says

The tool has functioned as a good lead indicator of changes in inflation momentum. When the reading is moving up it is an inflation acceleration alert and a move above 70% is usually cause for a general alarm. On the other hand, readings below 50% are a comfort zone.
Goldilocks & The Three Bears

Equity market resilience against war headlines, AI disruption fears, and private credit stress have so far been largely supported by a rare “Goldilocks” macro setup. Enter the three bears: Software stocks, private credit/BDCs, and bitcoin.
Fighting The Political Odds

The Trump administration inherited a fully employed economy, but one showing most leading indicators (except the stock market) flashing yellow or red. Nearly eight months into his term, that’s still the case—only more so.
In Memoriam Steve Leuthold

Steve Leuthold, a nationally respected investment strategist known for his contrarian nature and unpretentious style, passed away peacefully at his home in Carlsbad, CA, on March 7, 2023, at the age of 85.
Leuthold Chief Investment Strategist Jim Paulsen to Retire
Today, we are announcing that our Chief Investment Strategist, Jim Paulsen, will be retiring at the end of the year. Jim has been a popular counselor to our firm's institutional clients and a regular commentator in financial media. He will be stepping back from publishing and other day-to-day duties, but will remain a partner and senior advisor to our firm, which he joined over five years ago.
Jim is such an original thinker and provocative market forecaster, and we feel fortunate he chose to wrap up a long and distinguished career here at Leuthold. Our research clients and the millions of people who followed his work in hundreds of TV and print interviews were equally fortunate, having benefitted from his insights and, frankly, his knack for being right.
We’re going to miss Jim at a professional level — he has legions of fans on Wall Street and Main Street, but none bigger than the members of our own research and investment teams — and personally, as a friend and colleague. His family, the philanthropies he cares about and the Minnesota Timberwolves basketball team are all lucky to be getting more of his time and focus.
We wish him well with his new endeavors.
-John Mueller and Jeff Leadholm – Co-CEOs
Valuation Dispersions Reach 2009 Levels
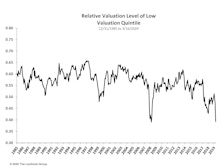
The recent market turmoil has only served to exacerbate equity style trends that have been in place for years, with Value, Small Caps, and High Beta all underperforming relative to Growth / Momentum, Large Cap, and Low Volatility, respectively.
Estimating The Downside
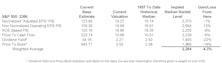
With the markets in freefall, we’ve seen a dramatic spike in interest in our monthly “Estimating the Downside” vignette. We think a mid-month snapshot is in order to give some idea as to how much meat has been taken off the valuation bone.
Owning S&P 500 At 2,900 In 2018 Vs. 2019

A look at underlying conditions at each stage of the bull market.
October Green Book Summary
The December 2018 stock-market low was the second most expensive among historical “major market lows.” The most expensive low was October 1998. The S&P 500 corrected -19.8% in late 2018, and by -19.3% in mid-1998. In the current post-correction rebound, the stock market’s breadth is more fractured than at the same stage in the rally following the 1998 correction.
Leuthold Quick Takes: Getting Sentimental
This issue of Leuthold Quick Takes reviews the conflicted nature of investor sentiment as seen by Doug Ramsey (Chief Investment Officer) and Jim Paulsen (Chief Investment Strategist).
April Green Book Summary
In the first three months of 2019, the S&P 500 surged 13%, its best quarterly performance in nearly ten years. This is strikingly similar to the rally of 1999—which may have been the most speculative in U.S. history.
March Green Book Summary
Based on standard technical retracements, the best-case S&P 500 bounce “should” have been exhausted in the range of 2,700-2,750. Less than three months since a 19.8% close-to-close decline, the market has rallied to within reach of a new high, a move which would commemorate the bull market’s 10th anniversary.
February Green Book Summary
The Research Summary is now available for download on our website for February 2019. The Research Summary provides a synopsis of The Leuthold Group's monthly market outlook.
Leuthold Quick Takes: Cyclical Bear Or Recovery Refresh?
The fourth quarter selloff and subsequent rebound, as seen by Doug Ramsey (Chief Investment Officer) and Jim Paulsen (Chief Investment Strategist).
Leuthold Quick Takes: Cyclical Bear Or Recovery Refresh?
The fourth quarter selloff and subsequent rebound, as seen by Doug Ramsey (Chief Investment Officer) and Jim Paulsen (Chief Investment Strategist).
January Green Book Summary
At some point in his career, famed stock trader Jesse Livermore ceased using the terms bull and bear, opting instead to describe trends in terms of “lines of least resistance.” He felt the change in terminology enabled a more flexible, unbiased mindset.
Ancient Forecasting Diagram Predicts Grim 2019

Published 60 years ago in a newspaper gossip column, this diagram forecasted a major market high in 1972 and a panic low in 1982.
3% Yields Proved To Be High Enough

In September the popular claim was that “interest rates were rising for the right reasons,” and still too low to threaten stocks or U.S. economic expansion.
Fake-Out Breakout?
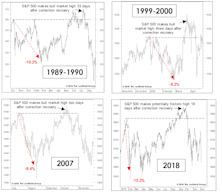
Throughout the recovery from the market’s early-2018 correction, we suggested any new high would be a good candidate for a “fake-out breakout” along the lines of those near the bull market tops of 1990, 2000, and 2007.
December Green Book Summary
The bears gorged themselves in the two weeks leading up to Thanksgiving and the S&P 500 closed at a correction low the day afterward. “Christmas” arrived immediately thereafter, with a six-day gain of 6%. But that was followed by a two-day collapse on December 4th and 6th, which undercut the post-Thanksgiving low on an intraday basis.
Perception for the Professional
July 2026 Issue

Featured Articles
Sector Navigator
July 2026 Issue
