10-Month Moving Crossover Strategy
Thoughts On The Secular Outlook

Some have speculated that 2022 might have been the kick-off for a decade-long era in which the broad stock market indexes will make essentially no progress, like 1966-1982. However, that earlier experience provided opportunities within other market segments, which will also stand a much better chance in coming years.
Multi-Asset: Winning By Losing Less
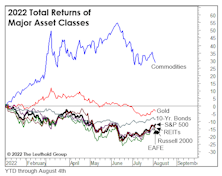
At the beginning of the year, we liked the chances for the “Donut Portfolio” to break its 10-year losing streak against the S&P 500. As a refresher, the Donut holds six of seven key assets in equal weights. The S&P 500 is excluded—a decision probably only suitable for allocators who are self-employed.
“Donuts”—The New Comfort Food
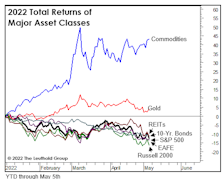
For the last few years, the S&P 500 has been the most richly priced of the broad equity indexes, and its moderate decline, to date, makes it even more so on a “relative” basis. In recognition of that, we began to track the hypothetical allocation strategy of avoiding this index.
Still An Uptrend… According To This

In an effort to manage stock market risk, we monitor reams of data relating to the economy, earnings, Fed policy, and investor sentiment, along with technical indicators of all stripes. But for the rare occasions when upside price action seems practically uncapped, it’s hard to beat pure price action if one is inclined to play along.
Time For “Timing?”

Valuations aren’t known as effective timing tools, but they can certainly help one decide when an attempt at timing may be appropriate. And if that time isn’t now, then when?
A Signal Bulls Should Love...

There’s no question that it’s been a rough couple of years for stock market technicians. We noted earlier that if February 19th stands as the final high of the bull market, it would be only the third time in the last 100 years that the NYSE Daily Advance/Decline Line failed to provide at least a few months’ advance notice of the oncoming bear.
The Trend Is Your “Fiend!”

Over the last year of market swings, we’ve tracked the horrific performance of what had previously been a solid long-term system for timing the S&P 500, the 10-month moving average crossover system. In the last 12 months, this generally low-risk approach has generated a total return loss of 13.74%.
Altitudes And Attitudes

Trend followers who use the ten-month moving average discipline finally had a positive month in July. But after the early-August decline, they are still holding an S&P 500 loss of 60 points from their latest trade initiated at the end of June.
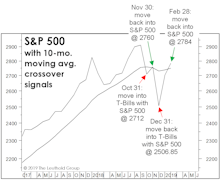
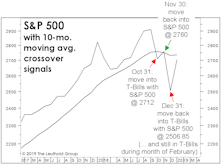
Does BUY Now Mean SELL?

Many technicians consider the 10-month moving-average crossover technique as the gold standard among long-term timing practices. The method was successfully applied to several asset classes in the SSRN’s most-downloaded paper of all time, “A Quantitative Approach To Asset Allocation” by Meb Faber.
Trend: The New Contrary Indicator?

Last month’s market action negated the month-old VLT BUY signals for the MSCI EAFE and Emerging Market indexes.
Time To Jump Back In?
A few pundits have suggested that Jack Bogle’s death in January might prove to be the symbolic capstone to a cycle in which passive investing has completely dominated the full-fee, active money-manager ranks.
Trend-Following Travails
To recap our allocation moves over the last year: We established an initial equity hedge in tactical accounts very close to the January 2018 highs.
Perception for the Professional
March 2026 Issue

Featured Articles
Sector Navigator
March 2026 Issue
