Asset Classes
New Policies, Old Outcome
At long last, we’ve exited an investment world that was defined for more than a decade by zero interest rates and Quantitative Easing. Or so we thought.
ETFs Evolving: Make Mine Mint Chip
The ETF concept began as a vehicle to provide low-cost access to a broad market index, and the terms “passive”, “cheap”, “index”, and “ETF” were often used synonymously. However, ETFs soon evolved into specialty funds that allowed investors to take focused active tilts in sectors, styles, and countries; a landmark shift away from the notion of passively investing in the total market. These specialty funds are easy to trade and tax efficient, but they do not fall under the labels of cheap, passive, or broad market.
Bridesmaid Track Record
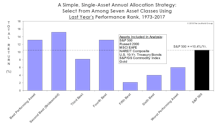
Overall, five of the seven assets available for the Bridesmaid strategy have underperformed the S&P 500 over the long-term, and three (Treasury Bonds, Gold, and Commodities) lagged by 390 basis points or more per year.
Bridesmaid Strategy Risk/Reward
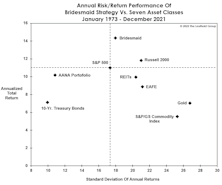
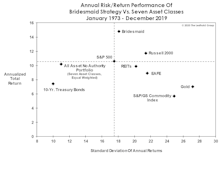
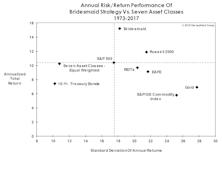
The “risk-adjusted returns” concept faded further into obscurity in 2021, with the year’s largest drawdown in the S&P 500 a mere -5.2%. But for those who still care about risk, the Bridesmaid strategy—though it often holds highly-volatile stuff like Gold, Commodities, and Small Caps—has been only about 1% more volatile than the S&P 500.
Momentum: Not Just For Stock Pickers
For those not blessed with clairvoyance, we’ve developed an asset selection strategy that’s done very well, historically, compared to the “naïve” AANA Portfolio and even against the almighty S&P 500. We’re not implying that investors dump their valuation models, economic forecasts, or their intuition. But they should recognize that price momentum tends to persist—not just among stocks and industry groups—but at the asset-class level as well.
Rewarding “Perfect Foresight”
Remember, the All Asset No Authority Portfolio assumes complete naïveté on the part of the portfolio manager. That’s one extreme of the asset allocation continuum—although few allocators would admit that such an approach might be viable, despite its respectable history.
Asset Allocation: A Rising Tide Lifts Most Boats
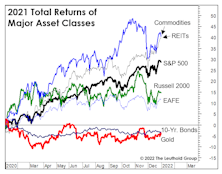
Boy, we thought policymakers had thrown the kitchen sink at the economy in 2020. Evidently, the Fed’s Marriner Eccles building has two kitchens, because they were able to do it again in 2021: M2 grew 13%, the Fed’s balance sheet swelled19%, and the 2021 federal deficit will come in at 12% of GDP.
Small Cap Valuations: Zombies And Ragamuffins
Asset allocation decisions are fairly straightforward for groups of profitable and growing companies that fit nicely into a discounted cash flow model, but it is more difficult to describe the valuation of groups that include unprofitable companies.
Bridesmaid Strategy Risk And Reward
We know that risk measurements have become passé, what with the S&P 500 having annualized at +13.6% in the last decade without a single drop of 20%. But the Bridesmaid strategy looks great relative to the available asset classes on a risk-adjusted basis.
Bridesmaid Strategy - Asset Classes
The best we can say about last year’s Bridesmaid asset—the S&P 500—is that it did not underperform “the S&P 500.”
Asset Allocation: As Bad As It Gets
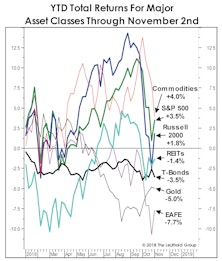
Asset Allocation in 2018 is about as bad as it gets. No major asset class has done well.
For Asset Allocators, As Bad As It Gets!
During 2018, no major asset class has done well, and in most respects the opportunity-set available this year has been among the worst in the last 50 years.
Bridesmaid Strategy: Risk & Return
The concept of risk is hardly at the forefront of the investor psyche after the second-least volatile year in stock market history.
Asset Allocation: Buy Strength Or Weakness?
We are contrarians at heart, but learned quickly that successful contrarian investing is far more complicated than simply buying assets that are down the most in price.
Bridesmaid Track Record
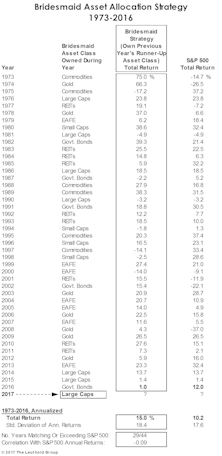
U.S. 10-Year Treasury Bonds—last year’s Bridesmaid holding—eked out a 1% gain in 2016, a disappointing result but one that preserved a streak of positive annual returns dating back to 2001 (Table 2).


