Bridesmaid
2022 Asset Allocation Review

We’ve heard for eons that “Low bond yields justify high equity valuations.” Value-conscious investors might have described this conundrum another way: “Low future returns in one asset class justify low future returns in another.” (Mysteriously, only the first rendition became a CNBC catch-phrase.)
Bridesmaid Sector Track Record
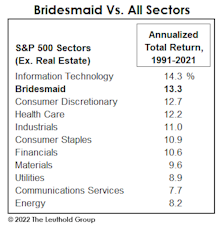
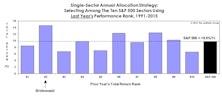
As noted, the Bridesmaid sector strategy has underperformed what has become a more difficult benchmark in five of the last six years. Those poor results have cut the annualized excess return of this approach to just +2.1% since 1991.
Bridesmaid Strategy For Equity Managers
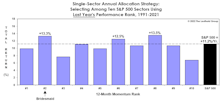
Once again, the idea is to dispense with macroeconomic trends, sector fundamentals, comparative valuations, and to base sector selection solely on the prior year’s total returns.
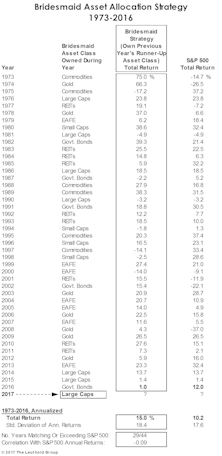
Bridesmaid Track Record

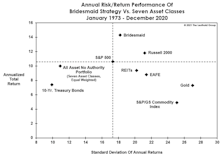
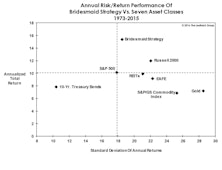
Overall, five of the seven assets available for the Bridesmaid strategy have underperformed the S&P 500 over the long-term, and three (Treasury Bonds, Gold, and Commodities) lagged by 390 basis points or more per year.
Bridesmaid Strategy Risk/Reward
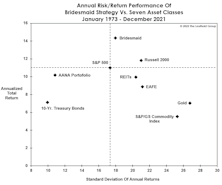
The “risk-adjusted returns” concept faded further into obscurity in 2021, with the year’s largest drawdown in the S&P 500 a mere -5.2%. But for those who still care about risk, the Bridesmaid strategy—though it often holds highly-volatile stuff like Gold, Commodities, and Small Caps—has been only about 1% more volatile than the S&P 500.
Momentum: Not Just For Stock Pickers
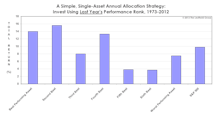
For those not blessed with clairvoyance, we’ve developed an asset selection strategy that’s done very well, historically, compared to the “naïve” AANA Portfolio and even against the almighty S&P 500. We’re not implying that investors dump their valuation models, economic forecasts, or their intuition. But they should recognize that price momentum tends to persist—not just among stocks and industry groups—but at the asset-class level as well.
Sector Bridesmaid Track Record
We’ve worried over the last several years whether momentum and other “alpha” factors have become exploited to the point of diminishing returns. It’s an arms race out there...
Bridesmaid Strategy For Equity Managers
Our work on the annual “momentum effect” dates back 15 years, and was originally based on equity sectors rather than asset classes. The hypothetical approach is to entirely dispense macroeconomic trends, sector fundamentals, and valuations, and base the allocation decision exclusively on momentum.
Bridesmaid Strategy Risk And Reward
“Risk-adjusted returns” were all the rage after the Great Financial Crisis. Now that such returns are likely to become relevant again, naturally, there’s little scrutiny of them.
Bridesmaid Track Record
With last year’s Bridesmaid (REITs) having laid an egg, the long-term “alpha” of the Bridesmaid portfolio narrowed to +3.7% from a bit over +5% (annualized) when we first published this study more than a decade ago.
Momentum Across Asset Classes
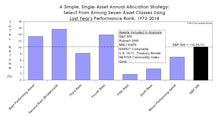
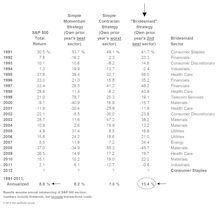
In the extreme case where one possesses no other information beyond last year’s total returns, the best single-asset strategy has been to buy the second-best performer (the “Bridesmaid”) and hold it for the next twelve months in hopes that the prior year’s momentum will carry it through. That approach has beaten the S&P 500 by 3.7% annualized over the past 48 years.
Sector Bridesmaid Track Record
2019 was the fourth consecutive year of underperformance by the annual Bridesmaid sector pick. Those poor results have trimmed the annualized “alpha” of the strategy to just +2.2% since 1991.
Bridesmaid Strategy For Equity Managers
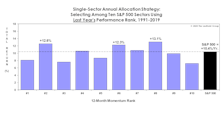
Our work on the Bridesmaid momentum effect dates back to 2006, and was originally based on equity sectors rather than asset classes. Again, the hypothetical approach is to ignore macroeconomic trends, sector fundamentals, valuations, and the like, and to base sector selection solely on the prior year’s sector total return rankings.
Bridesmaid Strategy Risk And Reward
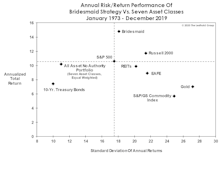
We know that risk measurements have become passé, what with the S&P 500 having annualized at +13.6% in the last decade without a single drop of 20%. But the Bridesmaid strategy looks great relative to the available asset classes on a risk-adjusted basis.
Bridesmaid Track Record
Here are the historical annual performance results for the hypothetical Bridesmaid strategy.
Bridesmaid Strategy - Valuations
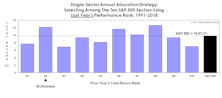
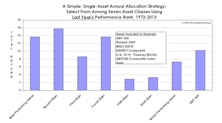
Momentum strategies aren’t for everyone. Still, contrarians should recognize that buying the prior year’s worst performing sector for a one-year hold has been an underperforming proposition over the long term.
Bridesmaid Strategy - Sectors
Our analysis of the Bridesmaid effect originated in 2006, but was based on S&P 500 sectors rather than asset classes.
Bridesmaid Strategy - Asset Classes

The best we can say about last year’s Bridesmaid asset—the S&P 500—is that it did not underperform “the S&P 500.”
Read This Before Taking The “Plunge”

After a bad market year like 2018, there’s a natural instinct for allocators to skew portfolios toward assets with poor recent performance. History suggests, though, that one shouldn’t make a habit of buying an asset on the basis of price weakness alone.
Bridesmaid Strategy: Low P/E Sector: Annual Results
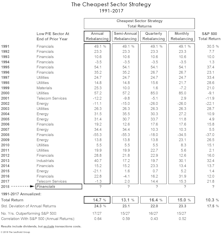
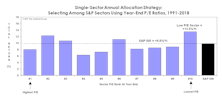
Table 5 shows annual performance results for the Cheapest Sector strategy under all four rebalancing frequencies, along with the lowest P/E sector for the annual version of the strategy.
Bridesmaid Strategy: A Value Alternative

For those not psychologically suited to a momentum approach, we’ve developed a contrarian sector allocation strategy that’s delivered even better long-term performance than the Bridesmaid approach.
Bridesmaid Strategy: Sector Track Record
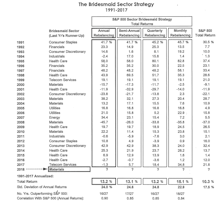
Table 3 shows annual performance results for the Bridesmaid sector strategy under all four rebalancing frequencies, along with the sector selection for the annual version of the strategy.
Bridesmaid Strategy: For Equity Managers

Our analysis of the Bridesmaid effect originated more than a decade ago, with an initial focus on equity sectors rather than asset classes.
Bridesmaid Strategy: Picking The Year’s Best Asset
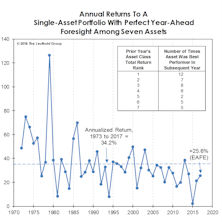
Here’s another way to look at the persistence of momentum across asset classes for the last 45 years.
Bridesmaid Strategy: Risk & Return
The concept of risk is hardly at the forefront of the investor psyche after the second-least volatile year in stock market history.
Bridesmaid Strategy: Track Record

Last year’s Bridesmaid gain of +21.8% matched the benchmark (obviously, since it was entirely invested in the benchmark).
Low P/E Sector: Annual Results
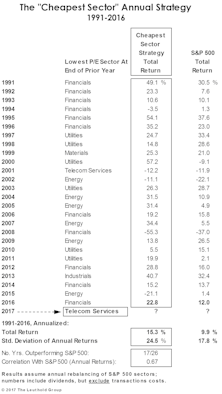
Table 6 summarizes annual sector selection and accompanying performance for the “Cheapest Sector” strategy back to 1991.
Bridesmaid Sector Track Record
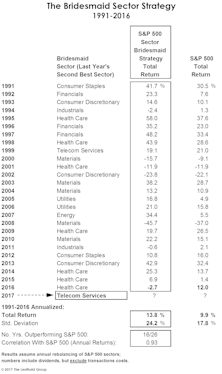
Table 4 shows the annual sector selection and accompanying performance results for the Bridesmaid approach dating back to 1991.
Bridesmaid Strategy For Equity Managers

Our analysis on the Bridesmaid effect originated back in 2006, but was initially based on equity sectors rather than asset classes.
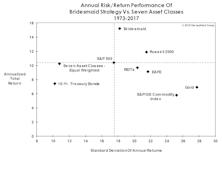
Bridesmaid Strategy: Return Vs. Volatility
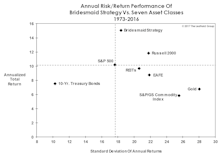
While the consideration of risk seems almost a quaint notion as the bull market nears its eighth birthday, it’s nonetheless worth noting the Bridesmaid allocation strategy has generated a favorable return/volatility trade-off in relation to: (1) the seven candidate asset classes; and, (2) the strategy of owning an asset class with a prior-year total return rank other than #2.
Bridesmaid Track Record
U.S. 10-Year Treasury Bonds—last year’s Bridesmaid holding—eked out a 1% gain in 2016, a disappointing result but one that preserved a streak of positive annual returns dating back to 2001 (Table 2).
Asset Allocation: Buy Strength Or Weakness?

The turn of the calendar seems to bring out the inner contrarian in some investors—those who will peruse last year’s list of lagging asset classes looking for rebound candidates.
Bridesmaid Asset Strategy
Liquidity “consuming” strategies like price momentum are generally considered to be more volatile than liquidity “providing” approaches like value investing.
Bridesmaid Sector Strategy
Our original research on price momentum dates back to the late 1960s, and was based not on asset classes but on equity sectors and industry groups. We stumbled upon the Bridesmaid effect, in fact, while testing a handful of simple strategies about a decade ago.
Asset Allocation & Sector Strategy: Follow The Trend, Or Fade It?
We are nothing if not contrarians, but have also highlighted the hazards of “knee-jerk” contrarianism—in which investors are instinctively drawn to the asset, sector, or stock that is down the most in price in the recent past.
Buy The Bridesmaid, Not The One Looking To Rebound
The investment leadership of a given year has historically had better-than-even odds of outperforming in the following year at both the asset class and equity sector levels.
Playing The Bounce - With A Twist
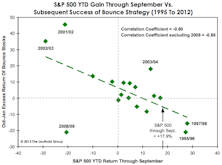
The historical batting average of this strategy has been decent, with gains in 9 of 18 years along with “excess” returns over the S&P 500 in 10 of 18 years. The best Bounce seasons have occurred when the market was either down for the year through September, or up only modestly.
Bridesmaid Revisited: Do You Buy Strength Or Weakness?
Our “second best really is best” analysis comes up with an asset class we like and a sector we hate, plus trying it monthly doesn’t work out quite the way we thought it would.
Buy Prior Year’s Winner, Loser, or Runner-Up?
The best strategy has been to buy not the prior year’s top performing sector or asset class, but to buy the runners-up—or “Bridesmaids”— of the prior year.
Dreams, Nightmares & Bridesmaids: Should You Hold On To Last Year’s Winners?

Of Special Interest asks “Should You Hold On To Last Year’s Winners?” by examining the Dreams, Nightmares and Bridesmaid strategies. This year, our analysis expands beyond equity groups to the sector and asset class levels.
Perception for the Professional
March 2026 Issue

Featured Articles
Sector Navigator
March 2026 Issue
