Cash Flow
Normalizing The Abnormal?
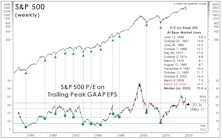
In recent years, we’ve supplemented our longstanding normalized earnings technique with the simpler method of referencing any past peak in EPS (or, for that matter, trailing peaks in other corporate fundamentals, like cash flow and sales per share).
ISM: Down, But Not Out
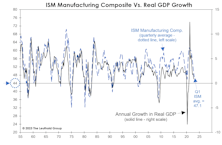
Early evidence shows the recent banking calamity knocked down already-fragile measures of confidence and activity, as exhibited by the ISM Manufacturing Composite posting a fifth-consecutive reading below 50.
The Earnings Recession Is History
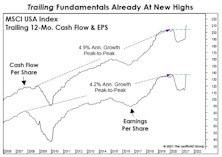
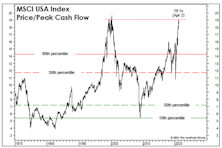
We expected that the earnings recovery from the shortest-ever U.S. recession would be the fastest on record. Trailing figures for the MSCI USA Index now confirm this: Trailing EPS and Cash Flow Per Share have surged to new highs only 14 months after their March 2020 peaks.
Valuing The Experiential Reopening
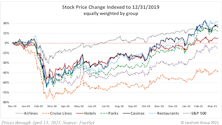
The onset of the COVID-19 pandemic in early 2020 brought a sudden halt to social gatherings, crowd events, and even personal contacts. Experiential business models were hardest hit by forced closures and lockdowns; cruise ships were forbidden to sail, restaurants and theme parks were closed, and air travel and hotel occupancy dwindled, all in an attempt to minimize personal interactions. The stocks of leisure services companies took a beating in March 2020, with Chart 1 documenting the virus’ impact on 34 large and midcap stocks representing this theme.
EAFE And EM: Long Past Their “Peaks?”

We applied the “Peak Cash Flow” valuation methodology to the EAFE and MSCI Emerging Markets Index and found them both priced at only about one-half of today’s MSCI U.S. multiple. However, the ratios are already above anything achieved during the 2009-2020 global bull market.
A Pricey Alternative To The S&P 500?
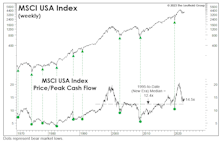
This month we focus on the valuations of the MSCI USA Index—which is nearly identical to the S&P 500. This is worth following mainly because the folks at MSCI are kind enough to provide us with much longer-term histories of Cash Flow and Book Value Per Share.
Research Preview: The Experiential-Reopening Trade
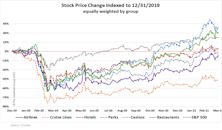
A strong argument can be made that experiential consumer services was the economic sector hardest hit by the pandemic lockdown. Cruise ships were forbidden to sail, restaurants and theme parks were closed, and air travel and hotel occupancy dwindled—all in an attempt to minimize personal/public interaction. The stocks of experiential companies took a beating in March 2020.
Calculate The Next Low... With The Last Peak?
How does one value a stock market in which 12-month forward EPS estimates show their widest dispersion in history? A good start might be with methods we use when forward estimates show practically no dispersion (like three months ago). In either case, we place little weight on such estimates; each revision usually has only marginal impact on our 5-Year Normalized EPS.
Cycles And Taxes And GICS, Oh My!
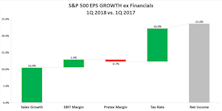
Analyzing quarterly financial results and developing insights about upcoming periods is always difficult, but the first quarter of 2018 was unusually complicated.
Multiple Contraction—Just A Little Patience?
Things were bigger when you were a kid. Like that enormous sweatshirt your aunt gave you for your birthday or that hand-me-down ten-speed bike with the cross bar taller than your shoulders.
Muster Drill: To The Value Lifeboats
.jpg?fit=fillmax&w=222&bg=FFFFFF)
While we’re not calling for an imminent market top, we are keeping a diligent watch from the crow’s nest for signs of a coming market correction.
Trends In Corporate Debt And Coverage Ratios

Long-term debt (LTD) issued by S&P 500 companies has risen 75% since 2010, and the resulting deterioration in leverage ratios has been all too evident.
Perception for the Professional
March 2026 Issue

Featured Articles
Sector Navigator
April 2026 Issue
