Cyclical Highs
The Short-Term Tea Leaves: Suddenly Wilting?
The “Nothin’ Matters” market lifted the S&P 500 to eight all-time highs in the nine trading days through July 7th. It’s been difficult to assail the stock market’s technical merits, but there are suddenly some short-term cracks among the handful of market indexes we consider “bellwethers.”
A Look At Two Historical Near-Misses
As we go to press (said no one in the digital age, ever!), the S&P 500 was moving to within a couple percentage points of its February 19th all-time high. Given still-high valuations for the blue chips and increasingly frothy sentiment, we think any break above that high will be underwhelming, if not a potentially historic “trap.”
The P/E Decline Has Been Greatly Exaggerated
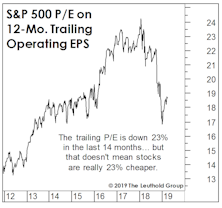
The S&P 500 has bounced back to levels seen at the January 2018 spike high, yet is valued more cheaply than it was 14 months ago.
Yet Another Anniversary?
We received two media calls in December hoping we would comment for upcoming special features about the tenth anniversary of the bull market. We rolled our eyes.
Guess-timating The Downside
While our market disciplines remain negative, we certainly aren’t oblivious to the haircut in equity valuations that’s already occurred.
Correction Creating Values?
While the consensus view remains that October’s stock market rout was “healthy” and “overdue,” we think it was more likely the first leg down of much larger decline. But it’s still worth reviewing the improvement in valuations that market losses and this year’s excellent fundamentals have combined to produce.
Four Paw Prints That Will Confirm Rumored Sightings Of The Bear
We think the odds are better than even that the September 20th S&P 500 high will stand as the stock market high for 2018, and perhaps also as the high for a historic event begun back in 2009. We’re well-prepared for that possibility, with the Leuthold Core now positioned today with net equity exposure of just 37%.
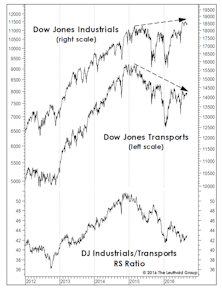
What Are The Transports Telling Us?
The MTI’s subset of Momentum measures entered September at a 6 1/2-year high reading of +1028, with only two of the category’s 40 inputs in bearish territory.
Sizing Up Small Caps
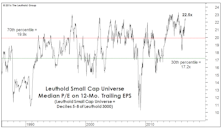
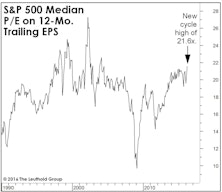
While the most inflated domestic-valuation readings are found in the Large Cap realm, the market rebound has driven the median 12-month trailing P/E in our Small Cap universe to 22.5x (Chart 1)—less than a point away from the June 2015 all-time high of 23.3x.
Rotation Away From Low Vol?
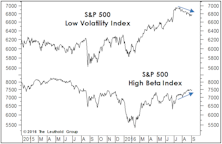
An encouraging break from a 15-month leadership pattern: Low Vol stocks have rolled over since mid-July, while the High Beta cohort has finally eclipsed its late-April highs.
Too Many New Highs To Make A High?
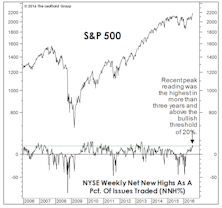
The number of NYSE 52-Week Highs typically peaks during the bull market’s strongest leg, before contracting into the final top. Last month, Net New Highs made a three-year high—implying more upside.
Not Entirely In Sync
Despite the market’s strong rebound from February lows, four of the seven “Red Flag Indicator” components have failed to confirm the July new-cycle S&P 500 highs.
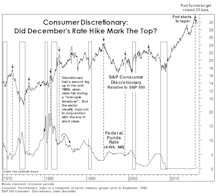
Discretionary: Is The Top Finally In?
Sector swings have been wild enough thus far in 2016 that Consumer Discretionary’s relative weakness has drawn little commentary.
Stock Market Observations
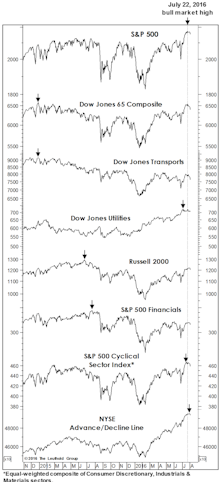
With the S&P 500 levitating near its all-time high, stock market leadership is peculiar—characterized by a flight to quality. And, despite the market’s violent bounce off February lows, there have been only four new market highs set by key indexes on our “Bull Market Top Timeline” table.
A Turn In Leadership?
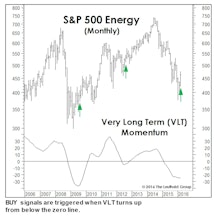
Last month we wrote that a big March gain would trigger a Very Long Term (VLT) Momentum BUY signal on the S&P 500 (Chart). The month’s 6.8% S&P 500 gain wasn’t quite enough to do the trick, but we’re intrigued that VLT did issue BUY signals for three of the market’s cyclical sectors, including Energy, Materials, and Industrials.
Ruminations On The Correction
If our market disciplines turn bullish in the weeks ahead, we’ll certainly follow that lead—covering remaining shorts, re-establishing a semi-aggressive market position, and wiping egg off our faces for having called a “cyclical bear market” that slammed the Russell 2000 (-26%), EAFE (-26%), and Emerging Markets (-37%)… but somehow not the one most followed, the S&P 500 (-14%).
Stock Market Observations
This bull market has appeared to be on shaky technical ground before, only for concerns to be swept aside. This time, we think it’s different.
No Time For The Hamptons
We’ve lived through many other low-volatility market rallies, but until the last couple of months we hadn’t experienced one in which clients, colleagues, and commentators were complaining so loudly of boredom.
The Tech Wreck That Wasn’t
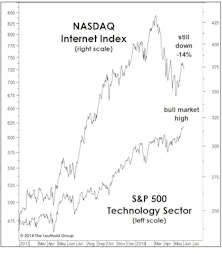
Although the social media darlings haven’t recouped their losses, the Technology Index moved to new cycle highs in early June.
Time For A Spring Shower?
The stock market staged a two-day bearish reversal beginning a few hours after the release of the March employment report, a decline that could —based on the bearish status of a single MTI category (Attitudinal)—carry further before it is finished. But with the S&P 500 (and many other U.S. equity indexes) recording a bull market high as recently as April 2, it’s too early to argue the market top is “in.”
Two Charts, A World Apart
Notwithstanding the opening days of June, U.S. stocks have shown remarkable strength considering the bull is now well into its fifth year.



.jpg?fit=fillmax&w=222&bg=FFFFFF)

