Election Cycle
Delayed Reckoning?
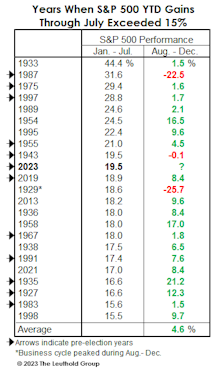
The month of October gets all the “love,” but since 1990, August has been the cruelest month for stocks. We point this out because calendar patterns lately seem to explain this market better than just about anything else. In 2022, big losses in stocks and bonds arrived right on schedule—during a time of Jewish sabbatical (the Shmita Year).
Small Caps Missed The Memo

For the first time since 1946-47, the super-bullish, six-month window beginning with the mid-term elections through the following April, failed to see a material upswing in Small Caps.
Yet Another Thing The Fed Has Screwed Up...
In today’s cycle, we’ve not yet observed the usual pre-election “ramp” in M2 growth. That might help explain why the traditionally hyper-bullish, six-month window beginning at the time of mid-term elections has so far been underwhelming.
Rose-Colored Remembrances
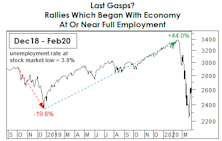
Monetary conditions have worsened, recession evidence is piling up, and some of our Large Cap valuation measures have returned to their tenth historical deciles. However, with the economy near full employment we thought it worth revisiting the past to find examples where the market might have temporarily thrived under similar circumstances.
A Real Stumper

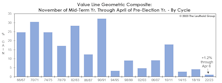
The equally-weighted Value Line Geometric Index has generated a 32.4% annualized price gain during the best six months of the presidential election cycle, measured back to its 1964 inception. In the other 42 months of the cycle, the index produced a -0.7% average annualized return.
Bulls, Bears, And Boxing

Bears normally walk on all fours, just like their congenitally happier counterparts. But images we see of bears attacking prey (or humans) usually show them on two feet. Maybe there’s a lesson there.
Irrationality Is Back, Right On Schedule
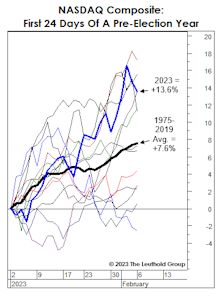
The hostile monetary backdrop makes recent stock market exuberance even more irrational than in early 2021. Yet, this is the middle of a seasonal window that historically boasts an elevated level of craziness: It is the year preceding a presidential election—a time when monetary and fiscal stimulus are ramped up.
A Trade Contrarians Will Love

Time cycles have been spot on in 2022, with the stock market declining through the mid-year months (May-October) of a mid-term election year. But November 1st saw the opening of the market’s most bullish window according to the same patterns.
A Year That Was Cursed From The Start

In January we put it bluntly: “Longer-term time cycles don’t line up for a prosperous 2022.” Not only is it a mid-term election year, but also a Shmita Year. Eight months later, the S&P 500 loss through August has exceeded 10% for only the twelfth time since 1926.
Cycles: A Key “Window” Is Approaching

Next month kicks off the seasonally-weak phase of the stock market’s Annual Cycle: May-October. Overlaid on that is the statistically vulnerable stretch of the four-year Election Cycle: the “mid-point” of the Mid-Term Year. There’s a positive way to spin this mid-term malaise: The cycles imply that an ideal window for a major low is about to open.
The Stock Market & U.S. Presidential Election Cycle Revisited
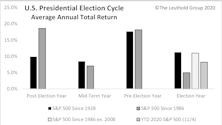
We crunch some numbers to see how 2020’s stock market trends have fared compared to the typical election year, and we slice and dice past post-election year trends at the sector and industry group levels to look at potential opportunities in the coming year.
The Stock Market Is Trading Like Trump’s A Democrat!
.jpg?fit=fillmax&w=222&bg=FFFFFF)
Around the time of Donald Trump’s inauguration in January 2017, we observed that prevailing valuations argued against him witnessing big stock market gains during his first term.
Seasonality Set To Favor The Bulls
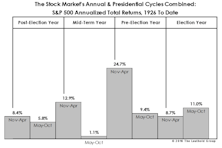
Our bearish stance could be tested by the arrival of the seasonally strongest six-month window of the four-year electoral cycle. Since 1926, November of the mid-term year through April of the pre-election year has produced an average un-annualized S&P 500 +16.4% total return.
Sell In May: Statistical Update
If this year’s interest in the “Sell In May” phenomenon is any indication, there remains plenty of skepticism surrounding the market’s recent rebound. The good news is that the “Sell In May” play has been weakest during presidential election years.
Perception for the Professional
March 2026 Issue

Featured Articles
Sector Navigator
March 2026 Issue
