Intrinsic Value
Speculating In “The Nebs”
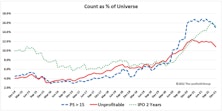
One measure of a bubbly bull market is the degree of speculative fervor embedded in the prices of companies with nebulous, indeterminate, or even nonexistent intrinsic values. Since the bear market low in March 2020, speculative manias have evolved in a menagerie of asset classes including Innovators & Disruptors, SPACs, meme stocks, crypto currencies, and NFTs. Based on the breadth of valuation extremes across numerous and diverse assets, this bull market may rank second to none.
Valuation Extremes: Here Be Dragons
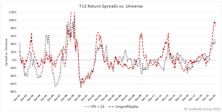
Top decile valuations are often the result of unduly positive investor sentiment that leads to inflated multiples. Bullishness comes in varying strengths: optimism, enthusiasm, exuberance, and, at the extreme, the mania of crowds. Because bullishness manifests itself in aggressive valuations for speculative companies, we believe the prices being applied to such companies - for which intrinsic value is dependent on a future that looks significantly different than today - are an excellent measure of investor sentiment. In that spirit, we examined past cycles of extreme valuations with the goal of understanding how they relate to investor sentiment and what they might tell us about market conditions and relative returns.
Research Preview: A Tale Of Two Tails
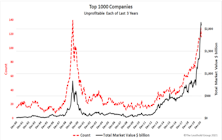
Top decile valuations, such as those in place today, are usually the result of excessively positive investor sentiment that leads to inflated multiples. Bullishness comes in varying strengths: optimism, enthusiasm, exuberance, and, at the extreme, the mania of crowds. Leuthold research typically tracks valuation sentiment by examining median P/E ratios, but in this study, we are taking the opposite tack. Rather than looking at medians, we are focusing on the outliers in each tail of the valuation distribution.
Rally Extension?
We’ve boosted equity exposure twice in the past several weeks, fully cognizant that it’s not a “textbook” time to do so.
Valuations: The Correction That Never Was
The correction failed to meaningfully “reset” any long-term valuation measures, hence, we don’t view the current environment as having much investment merit, but rather, primarily speculative appeal.
The Bullish Case: A Mental Exercise

We’ve been correctly positioned near our tactical portfolios’ equity minimums, yet we’re oddly compelled to use this month’s “Of Special Interest” section as a very public second-guessing of that move.
Stock Market Valuation Check
It now goes almost without saying that whenever the stock market moves to a new cycle extreme, so does the MTI’s Intrinsic Value category. In late May, this reading dropped below –400 for the first time in this bull market, and is now within 150 points of its 2007 extreme.
Cashing In Some Chips
I’m sure I’m not the only one who’s grown weary of the media’s “Sell In May” obsession in the last several weeks. In my case, I felt this old piece of stock market wisdom would be late by at least two weeks here in 2013. (But, as of early May, I was wrong.)
I’m Still Afraid of Heights

Intrinsic Value benchmarks for each stock market average, using 1957 to date data. Using 1926 to date data the calculations are even more frightening.
The Mixed Messages Of January
It was a shaky 1998 start, but the U.S. equity markets got it together after the big hit on January 9th (-3%).
August Insights

Secondary stocks’ August performance, growth vs. cyclical and growth vs. value performance, S&P and DIJA historical valuations and the Royal Blue Index.
How High Is High?/How Low Is Low?

An update of The Leuthold Group’s Intrinsic Value Benchmarks provides a way of estimating upside and downside potential for the DJIA and S&P 500. How much higher might the stock market go in the next year…..and what is the bear market downside risk?
Inside the S&P 500, 400 and the DJIA

From time to time, there are client inquiries concerning the foundations of The Leuthold Group’s fundamental intrinsic value judgements, relating to the S&P 500, 400 and the Dow Jones Industrials. Here is a current data summary regarding these three stock market indices.
How High Is High?

The Leuthold Group’s Intrinsic Value Benchmarks provides another way of estimating upside potential for the DJIA and S&P 500. Based on the past history of bull market valuation levels, where might the stock market be 12 months from now?
Stocks Not Cheap, Stocks Not Expensive

Stocks are now in the high 40%-45% of the historical valuation distribution range. This is not cheap, but neither is it expensive. Based on our Benchmarks work, it now appears we can expect average performance for the stock market from today’s levels over 1, 3 and 10 year time horizons.
Continuing Client Questions

If the Index does shift to the positive side, how can you (in view of your own intrinsic value work) justify aggressively buying stocks? Considering the downside risk, is it really worth it to aggressively buy equities if your Index now turns positive? If your Index does turn positive, what are the chances it might be a whipsaw?
Client Questions About Our Equity Strategy

Most, but not all of these are actual client questions recently fielded by The Leuthold Group. A few are questions we think some of you might like to ask, but are reluctant to do so.
Projecting Stock Market Levels Using Intrinsic Value Benchmarks

How far would today’s stock market have to fall to achieve normal benchmark valuation levels? How far would it have to fall to reach 1987 post-crash levels? On the brighter side, how far up would today’s market have to move to match the valuation extremes of 1987’s third quarter?
Intrinsic Value Update

We apologize for the unanticipated Benchmarks delay. In the meantime, per client requests, here are updated histograms for our primary stock market value benchmarks, including commentary. We are pleased that so many of our clients really do use this work.
Well…November Was Better Than October

The cyclical bear market appears to be bottoming, but that is only an opinion. Although improved, the Major Trend Index remains negative. Thus, we remain very cautious. We respect the numbers more than our opinion.
Value Benchmarks

The stock market is no longer radically overvalued. The current readings on these benchmarks approximate the readings at some past cyclical bear market lows. History tells us that new cyclical bull markets do not always have to come from grossly undervalued levels.
A “New Era” Version of the Major Trend Index?

Our published Major Trend Index has been registering negative readings since spring. But what happens if we remove the Intrinsic Value measures from the Index?
Intrinsic Value Benchmarks

Almost any way you cut it, the U.S. stock market is historically very overvalued. Only by comparisons with Japan and perhaps Singapore, can U.S. stocks be viewed as relatively attractive.
Intrinsic Value Benchmarks

We were not planning to publish the Leuthold Group’s Histographs this issue. But clearly a number of clients have a high level of interest in this work. We had a large number of calls this last month requesting updates. So, here they are again.
Focus: Intrinsic Value Benchmarks

Updated histographs of P/E multiples, book value ratios and yields are presented this issue, as well as a new histograph of cash flow ratios.
Benchmarks……Intrinsic Value

It has been only two months since we last published our “Histographs” covering stock market P/E’s, dividend yields and book value ratios. But, 1987 estimates are now included and of course, the stock market has made a big move. It is time for an update.
Benchmarks......Intrinsic Value

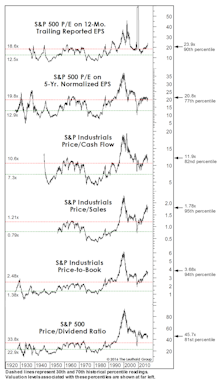
Today’s normalized P/E multiple is close to the high quartile, with dividend yields in the low decile and book value ratios close to their high decile. The cash flow ratio is about at its historical median, but other benchmarks demonstrate the stock market’s potential downside vulnerability.
Client Questions

Here again are some of the client queries we have had over the last month or so.
Intrinsic Value Perspective

The stock market, at least according to the most popular market indices, has rebounded to its former 1986 peak levels. Updated histographs are included herein, providing perspective in terms of P/E’s, Dividend Yields, and Book Value ratios for the S&P 400.
A Demonstration: Stock Market Potential By P/E Level

Over the past 57 years, what kind of future performance did the investor experience when the market was at 10 times earnings? 15 times earnings? 20 times earnings? Based on this work, over the next five years total stock market returns should not be expected to exceed 6% per year.
Intrinsic Value Comparisons

How does the market stand today in terms of historical ranges? Overall, it is above the historical medians for these intrinsic value measures, but not yet extremely overvalued. Clearly though, for the first time in twelve years, the stock market is no longer cheap.
Perception for the Professional
March 2026 Issue

Featured Articles
Sector Navigator
March 2026 Issue
