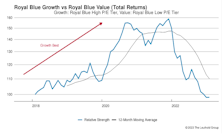
Royal Blue
Growth vs. Value vs. Cyclicals
Both Growth and Value Small-Cap style boxes gained 10% in January’s rally. However, SC Growth remains well in the rearview mirror since its relative strength peak in September 2020: Small Cap Growth +8% versus Small Cap Value +60%.
Royal Blue Index - October 2014
In Q3 the High P/E Tier was the best performing subset, up 2.1%. However, the High P/E Tier has lagged the other two segments significantly YTD—up only 3.1% compared to +10.1% and +11.8% for the Mid and Low Tiers, respectively.
Royal Blue Index - July 2014

In Q2, the Low P/E Tier was the best performing subset, up 6.6%. The Low P/E Tier also leads YTD +9.6%. The High P/E growth names are lagging severely YTD, up only 1%.
Royal Blue Index - April 2014

In Q1 the High P/E Tier was the worst performing subset, down 2.2%. It was the best performer in 2013 (+39.9%), with the Middle P/E Tier (+33.0%) and Low Tier (+33.9%) trailing.
Royal Blues: High P/E Tier Beats S&P 500

The High P/E Tier is now slightly overvalued, the Middle P/E Tier is overvalued, and the Low P/E Tier continues being quite overvalued.
Growth/Value/Cyclicals Market Internals

Growth Stocks Lead YTD In All Three Cap Categories.
Large Cap Growth Bounces Back The Past Two Months

Growth stocks are now all above their historical average valuation levels. Value stocks are all solidly overvalued compared to their recorded averages.
The Cream of the Institutional Equity Crop Broken Down By P/E Multiples - October 2013

In Q3 the High P/E Tier was the best performing subset, up 7.6%. It is also the best performer YTD (+23.7%), with the Middle P/E Tier (+22.9%) and Low Tier (+21.7%) just behind.
Growth Continues Leading In Mid And Small Caps YTD, Large Cap Growth Bounces Back

All three cap tiers of Growth also now ahead for the YTD. Growth stocks are moving towards their his- torical average valuation levels, with Mid Cap Growth now being overvalued. All Value stock segments continue to be solidly overvalued.
Growth Continues Leading In Mid And Small Caps YTD But Lags In Large Caps

Growth’s leadership over Value has only been apparent in Large Caps, but this segment had a big short-term reversal in recent months. Large Cap Cyclicals (+7%) significantly lag Large Cap Growth (+17%) YTD.
Growth Leads In Mid And Small Caps But Lags In Large Caps

Growth’s longer term trend of leadership over Value has only been apparent in Large Caps, but this segment had a big short-term reversal in Q2 and July.
The New Nifty Fifty—Time To Become A Believer Again?
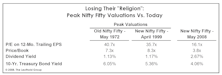
These once elite companies have continued to turn in good earnings growth. The problem had been that the prices had moved far too high. After a few years of declining prices, the valuations are once again looking very compelling.
Large-Cap Growth: Could A Long Wait Get Even Longer??

Valuations set the stage for better performance out of growth. But it is important to note that there’s precedent for the value cycle—seemingly already overextended in time and price—to get much more extended.
High P/E Stocks: Becoming A Safe Place To Hide?

Value continues to have leadership position over Growth among Large Cap stocks. Mid Caps also shifting to favor Value, but Growth still leading in the Small Cap tier.
Royal Blues….Annual Reconstruction

Ten new components inserted into this list of the 99 stocks with the largest institutional ownership. Smallest turnover in four years. Russell also being rebalanced.
Royal Blue…..Annual Reconstruction

Eleven new components, six of which are first time qualifiers.
The Royal Blues…Revision And Comment On Newly Revised Institutional Favorites

A record 13 new equities achieved Royal Blue status. Today, technology, media and communications make up 40% of the Royal Blues, compared to about 23% five years ago.
The Royal Blues…Revision And Comment On Current 99 Institutional Favorites

The Royal Blues studies currently identify the 99 U.S. institutional favorites…those equities with the largest dollar value and broadest institutional ownership.
Why We Are Buying Big Cap Growth Stocks Now

Big cap growth stocks appear to be in the early stages of regaining leadership from the “tired” cyclicals and “overvalued” value stocks.
In Search of Blue Chip Growth Stocks

Growth stocks have been out of favor over the past 3-4 year, but look poised to regain leadership over the next 6-12 months.
A Royal (Blue) Look At Growth Stocks (And Value Too)

When value investing requires so much effort just to locate purchase candidates, you might want to re-evaluate your equity sector asset allocation strategy if you have that option. What do the growth stocks look like?
The Message of Phillip Morris

Six months ago, this stock was at the top of most institutions' core holding list. Smashed and broken, it's now a major portfolio embarrassment. Once again, the often forgotten message from the past echoes: No Growth Is Permanent.
August Insights

Secondary stocks’ August performance, growth vs. cyclical and growth vs. value performance, S&P and DIJA historical valuations and the Royal Blue Index.
Are Higher P/E Institutional Stocks Now Relatively Attractive?

Compared to low P/E institutional stocks, the high P/E institutional stocks are very cheap in terms of relative P/E’s. But don’t get too bullish yet. There is more to the story.
Royal Blue Index...An In Depth Appraisal
A number of years ago The Leuthold Group developed an analytical tool we call the Royal Blue Index.
Is It Nifty Fifty Time?

Quality Growth stocks led the market in November and are now also outperforming the market year to date. Now that we have so many value players, is the stage set for an extended period of big growth stock leadership?
High P/E Quality Stocks Now Cheap

High P/E Quality stocks are now very cheap on a relative basis, at least when compared to low P/E stocks. Unfortunately, our timing work does not yet show favorable market momentum developing for these issues.
Annual Component Changes in Royal Blue Index This Issue

Turnover in the top 60 stocks most heavily owned by institutions is higher than normal. Some of the changes were expected while others were mild surprises.
Perception for the Professional
March 2026 Issue

Featured Articles
Sector Navigator
March 2026 Issue
