Signals
Is This Year’s Strong Start “Signal Or Noise?”
.jpg?fit=fillmax&w=222&bg=FFFFFF)
This year is off to a much stronger start than suggested by the 3-4% gains in the blue-chip averages: Through January 12th, the Value Line Arithmetic Composite—an equally-weighted index of about 1,700 stocks, was up 7.0%.
Jay Powell, The Chartist
.jpg?fit=fillmax&w=222&bg=FFFFFF)
When Jerome Powell took the reins of the Federal Reserve in early 2018, many commentators cheered the fact that he does not possess a Ph.D. in Economics. It will be many, many years before historians are able to conclude whether that’s a good or bad thing.
Yesterday’s action, though, left us wondering whether Powell might stealthily be in the process of earning a different designation—that of Chartered Market Technician (CMT).
VLT: A Double-Sworded Edge

“Oversold” usually has a positive connotation in financial jargon, yet history’s worst air-pockets have almost always occurred when the stock market was deeply oversold. More time is needed before a “low-risk” entry point for the S&P 500 will be triggered from the VLT’s currently “oversold” status.
What Will A Low “Look Like?”

We think it’s much too early to be looking for a major bottom in stock prices, but it’s worth reviewing some of the signals that will help confirm such a low is at hand.
Don’t Fight The Tape?
Longstanding concerns over the stock market’s lofty price tag are frequently dismissed with the observation that “valuations are not helpful timing tools.” We don’t disagree. In that spirit, then, let’s review three simple trend-following models that have been useful timing tools.
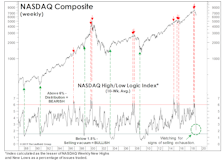
Limping Into Wildcard Weekend With A Compound Fracture
.jpg?fit=fillmax&w=222&bg=FFFFFF)
We wrote in the latest Green Book that a breadth indicator that should be more well-known than it is—the High/Low Logic Index (or HLLI)—had moved to “maximum negative” right at the cycle high in the NASDAQ Composite on November 19th. Specifically, the 10-week moving average of this indicator showed a perilous internal condition in which too many NASDAQ stocks were reaching 52-week New Highs and New Lows simultaneously. That’s the very definition of a “fractured” market, and has preceded some important NASDAQ declines. There have also been a couple of premature warnings, as in the summers of 1996 and 2019.
Let Us Add To The Bullish Cacophony
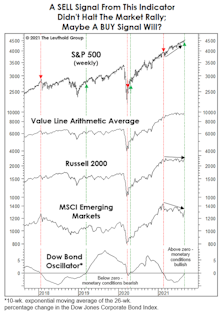
It’s been a heck of a stock market year, and there are still four months left. What else could go right? Monetary conditions, for one thing—at least as proxied by our Dow Bond Oscillator (DBO).
Smarter Than The Bond Market?

The half-percentage-point drop in the 10-year Treasury yield, since mid-March, has investors worried about “what the bond market might know” that the stock market doesn’t. Maybe it’s time to stop lionizing the bond market’s prescience and give the stock market its due.
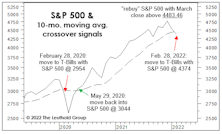
Stocks And Yields Revisited
.jpg?fit=fillmax&w=222&bg=FFFFFF)
The S&P 500 and 10-Year Treasury bond yield could accomplish something fairly rare today by closing at “joint” 52-week highs. The relevant levels to meet or exceed are 3934.83 on the S&P 500 and 1.49% on the bond yield.
Should You Trust The Thrust?

During the first two months of the rally (and +30%) off the March lows, we noted that the usual cyclical leaders of a new bull market were underperforming on a relative basis, and there had been nothing even close to the “breadth thrust” that often accompanies an initial bull market up-leg.
Watching For An Internal Washout
Having monitored market internals for warning signs for longer than we care to admit, it’s refreshing to turn around and watch many of the same signals for… wait for it... BUY signals!
Bond Investors Get It Right Again!

Having devoted all of our professional lives to the monitoring and modeling of equity markets, we’re naturally ticked off that this year’s best stock market signals have in fact been rendered by bonds.
Learning From Failures?
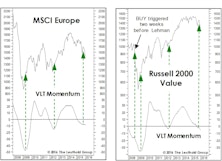
There’s an old trader’s adage which holds that “the most powerful sell signal is a failed buy signal.” Last fall we noted that European equities and Small Cap Value had triggered BUY signals on our Very Long Term (VLT) Momentum algorithm.
BUY Signals In A Topping Market?

Here’s an example of just how disparate underlying market action has become: with the S&P 500 only 2% away from a cycle high, several major U.S. and foreign market indexes have already moved into an oversold position on the basis of our Very Long Term (VLT) algorithm—with a few (including EAFE, Chart 1) actually triggering “long-term, low-risk” BUY signals in the last two months! We are not sure what to make of this action.
A Whimpering Sell Signal...
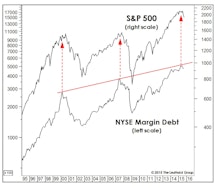
It’s been more than two years since NYSE Margin Debt broke out above its 2007 high, and we remember the rash of bearish commentary that accompanied that milestone. We later showed the Margin Debt increase was almost perfectly proportional to the gain in the stock market itself, and not a reason to turn bearish in and of itself. But our tune has changed.
A BUY Signal That Says SELL?
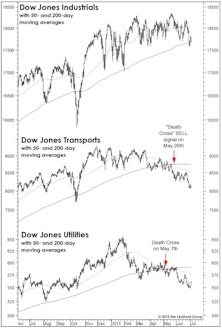
Last month we discussed the negative market implications of May’s “Death Cross” signals in the Dow Transports and Dow Utilities.
VLT Momentum Buy Signals...Good News For Small Cap Fans

Maybe we are too cautious about calling a turn in relative small cap performance. VLT work on Russell 2000 and Value Line now both giving buy signals.
Major Trend Deteriorates In September, Remains Negative

Major Trend Index deteriorated by 591 points in September, and remains quite decisively in negative territory. We continue to approach equity investing with a great deal of caution, operating in a bear market mode.
Early Warning Index

This aspect of our work has not been particularly helpful recently, even though it at times has been quite productive in years past. We can't squeeze blood out of a turnip and in recent years we haven't been able to squeeze a 7%-10% correction out of the low volatility market.
Questions Clients Are Asking

Since the Milwaukee poll taken in early October, it appears that optimism has continued to build. This opinion is supported by the kinds of questions we are now fielding from clients.
“When The Bears Have Thanksgiving…..”

As I recall, at one time I checked out the accuracy of this stock market folklore and it seemed to work pretty well. I think it will prove true again in 1991.
August: A Dull Month (Except for Four Days)

If you had been vacationing on an island with no communication during the last two weeks of August, you’d think from the month to month statistics that August 1991 was a big late summer yawn.
Major Trend Index Improved, But Still Negative

This issue marks the first anniversary of the most recent Major Trend Index sell signal, transmitted to clients on Halloween 1989. Here in October 1990, this work has improved significantly from a month ago.
VLT Momentum: Based on DJIA Monthly Averages

In the fall of 1988, this publication detailed a very reliable long-term stock market indicator we call VLT momentum. Herein, we present the record tracking back to 1897, employing average monthly prices in the calculation rather than month end prices.
Three Steps and Stumble

The most recent rise in the discount rate triggered the “Three Steps and Stumble” rule. Years ago, Edson Gould popularized this theory. In effect, it is based on the assumption that tight credit ultimately terminates a bull market.
Perception for the Professional
March 2026 Issue

Featured Articles
Sector Navigator
March 2026 Issue
