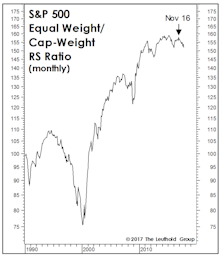
S&P 500 Equal Weight
Echoes Of 2021
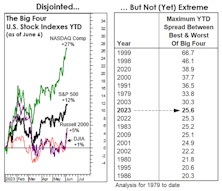
The NY FANG+® Index is up 68% YTD and +21% in the last month, with the Equal-Weighted S&P 500 up less than 2% YTD. Yet a measure of internal market disparity has 2023 barely cracking the top-ten of “incongruent” market years—meaning it can get worse before it gets better.
Additional Factors
The S&P 500 had an almost biblical upheaval to start 2023. The “last were first” and the “first were last.” In January, the 100 worst performing stocks of 2022 had an average return of +16.1% while last year’s 100 best performers posted +1.7%.
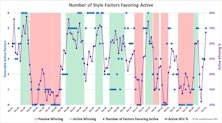
Fair Winds For Active Managers
The defining characteristic of last year’s bear market was the collapsing valuations of speculative growth stocks. A mania for themes such as cloud computing and disruptive innovation during 2016-2021 drove those names to fantastical valuations and bestowed market capitalizations of tens- and even hundreds of billions of dollars on such companies, many of which had yet to turn a profit.
S&P 500 Dividends? Thank You, No!
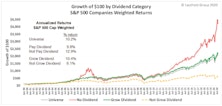
Dividends are a cornerstone of equity investing and over the decades they have produced a significant portion of the stock market’s total return. Previous Leuthold research has identified a strong dividend influence on total returns for small and midcap companies. Looking at S&P 500 constituents, we see that dividend growers outperformed companies that had flat or declining dividends – an expected outcome. However, we also found that companies not paying dividends convincingly outpaced dividend payers. This is contrary to the results in other market segments, but the explanation for this becomes apparent in the course of our research.
Median Valuations: Down, But Not Cheap
If we assume that valuations will “bottom” at the “richest” levels ever seen at a bear market low, there’s still 32% downside remaining in the median S&P 500 stock.
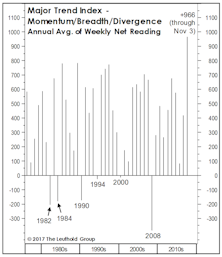
A Market Breadth Mystery
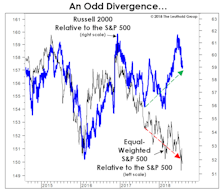
It’s difficult to knock a stock market in which Small Caps and major breadth measures are making frequent new highs, however, there are performance anomalies that suggest liquidity is no longer sufficient to “float all boats.” Recent underperformance of the Equal Weighted S&P 500 is a case in point, at the same time, the current dichotomy in market breadth pales in comparison to the 1999-2000 episode.
Try This On For Size
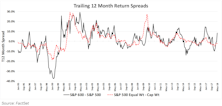
Today’s market is barbelled regarding company size, with the mega-cap Tech stocks and the S&P 600 Small Cap index both outperforming the middle of the S&P 500.
Breadth Is Great— Except Where It Matters The Most
.jpg?fit=fillmax&w=222&bg=FFFFFF)
Last week’s piece challenged the now popular view that new highs for the Russell 2000 are a decisively bullish factor for the stock market in the near term. To our surprise, we found that market returns during periods of well-defined Small Cap leadership are significantly lower than when Smalls are laggards.
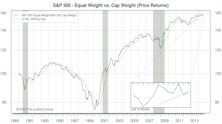
Cap Weight Or Equal Weight?
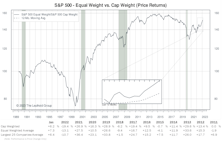
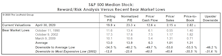
The Equal Weighted S&P 500 now trails the S&P 500 by 400 basis points YTD, and the rally is increasingly assailed as too narrow.
Stock Market Observations
We remain bullish on stocks but with very limited visibility into 2018.
Additional Factors
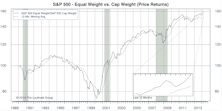
The Equal Weighted S&P 500 edged out the Cap Weighted index by 20 bps in August and expanded its lead to almost 1% YTD (price change only).
Additional Factors
S&P 500: Equal Weighted better in june.
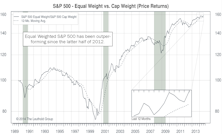
S&P 500: Equal Weighted Index Continues To Excel
As the market rallied in February, the S&P 500 Equal Weighted Index (+5.2%) handily outperformed the Cap Weighted S&P 500 Index (+4.3%).
Answering Client Questions
We always welcome the chance to hear what’s on our readers’ minds, and have often found that seeking answers to these questions can lead to new research topics, interesting charts, and new ways of looking at things.
Perception for the Professional
March 2026 Issue

Featured Articles
Sector Navigator
March 2026 Issue
