Stock/Bond Correlation
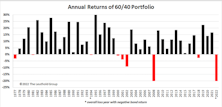
The 60/40’s Annus Horribilis
The balanced portfolio strategy of allocating 60% to equities and 40% to fixed income generated a highly satisfactory 7.9% annualized return over the last 30 years. Despite the excellent returns earned by investors following this strategic model, the past couple of years have seen a parade of articles with headlines such as “Is the 60/40 Portfolio Obsolete?” and “Is the 60/40 Dead?” Given the central importance of this moderate allocation strategy to investment industry practices, we felt a closer look at the 60/40 portfolio was in order.
Research Preview: The 60/40 Skeptics Were Right
The 60/40 strategy is having a terrible year, and its failure to protect investors in the bear market prompted us to take a look at the history and theory of the 60/40 guideline. We offer an early preview of the study, with a focus on 2022’s abysmal year-to-date returns.
Stock/Bond Disconnect?
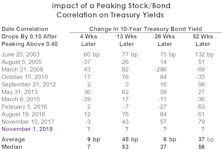
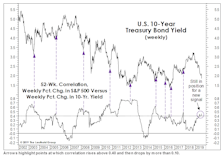
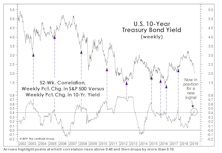
In the May Green Book, and again in the May 21st issue of “Chart of the Week,” we discussed the trailing one-year correlation between weekly percentage changes in the S&P 500 and the 10-year Treasury bond yield. Rollovers from high levels in this correlation have signaled most of the important pullbacks in the bond market over the last 20 years.
What The Two-Month Stall In Bond Yields Tells Us
The 10-year Treasury yield has absorbed the past two months’ worsening inflation numbers by going exactly “nowhere.” Bond investors seem to be all-in on the Fed thesis that the inflation pickup is just transitory.
During the recent consolidation, however, the Treasury yield showed a subtle change in character—one that suggests there might be more inflation paranoia than meets the eye. The 10-year yield’s daily correlation with stock price movements flipped negative, and then plummeted toward a 21-year low.
Two More Reasons For Yields To Rise
Bond yields have paused in the last several weeks, but we think it’s likely to be a pause that “refreshes.” Many bond indicators, including the Copper/Gold ratio popularized by Jeffrey Gundlach, suggest yields should be moving dramatically higher in the months ahead.
Simple Bond Model Says “SELL”
In our minds, the big story is not the nominal new highs in the blue chips, but rather the rapid changes now occurring on both an “intra-market” and “inter-market” basis. In the case of the latter, we have an important new signal from a simple correlation model we developed earlier this year.
Odds & Ends
Here are some brief follow-up notes on topics covered in recent months’ Green Books.
Correlations Are Worthless, Except This One
We’ve never understood investment quants’ desire to project correlations among assets. Such correlations are inherently unstable.
Stocks Not Yet Yielding To Yields
Regardless of how it’s measured, the liquidity available for global stocks continues to run off.
New Highs In Stocks Have Some Unwanted Company
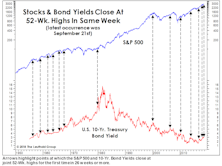
In recent commentaries, we’ve highlighted the surprising number of U.S. stocks making 52-week lows on both a daily and weekly basis, a sign that the market’s push higher has become more fractured. While pondering the significance of those lows, however, we missed a new 52-week high last Friday in a series we think will be especially critical to the stock market’s near-term fortunes: the 10-year U.S. Treasury bond yield. Specifically, the yield matched its weekly closing high of 3.07% posted on May 18th.
Where The Bear Lingers
While the next recession could be caused by a variety of factors, we suspect the recovery will eventually end like most post-war expansions, only after a significant rise in interest rates.
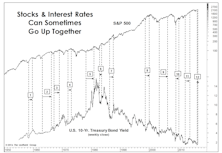
Rising Rates: Not Always A Death Knell
While the Dow Jones Bond Indicator has stood the test of time, history shows that rising bond yields are not always a bearish stock market phenomenon.
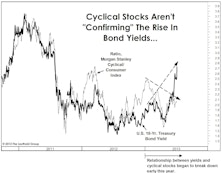
Bonds & Cyclical Stocks “Decoupling”?
The relationship between U.S. Treasury bond yields and the relative performance of cyclical stocks versus their defensive consumer counterparts appears to be changing.
.jpg?fit=fillmax&w=222&bg=FFFFFF)
.jpg?fit=fillmax&w=222&bg=FFFFFF)
.jpg?fit=fillmax&w=222&bg=FFFFFF)
