Paulsen's Perspective
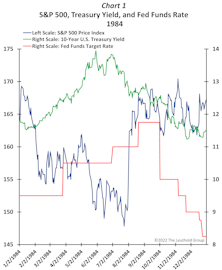
EASING Has Begun...
The Federal Reserve has not yet begun easing, but “Easing” is a multi-dimensional event, and increasingly, the outlines of a new cycle (often associated with the beginning of a bull market) are coming into focus.
“INVERTED” Is Such A Scary-Sounding Word!
The yield curve (i.e., the 10-year bond yield less the 3-month bill yield) finally “INVERTED” in late October, raising significant fear among investors. It is a scary-sounding word. Consider some of its synonyms: upended, capsized, backward, upset, confused, disordered, jumbled, haywire, and wrong-side-up.
Government Economic Policies Are Best When “Ho-Hum”
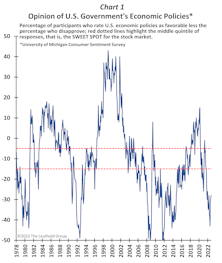
Since the dot-com crash, there has been general disappointment with government economic policies—both fiscal and monetary. In the aftermath of the 2008 financial crisis, apprehension about economic programs surged, and after a brief respite from 2016-2020, the outlook since the pandemic has again darkened considerably.
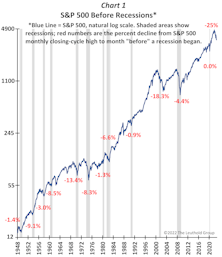
What If The Low Is Already In?
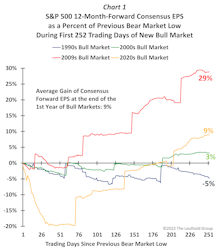
There is still considerable debate about whether the bear market has yet set its low. Certainly, if the U.S. economy is headed for a deep recession, stock investors will face additional, significant downside risk. Several smart bears on Wall Street suggest the S&P 500 could decline to about 3,000—or -25% from today’s level—as analysts are forced to cut earnings estimates. However, if the economy manages to avoid recession or experiences only a modest contraction, a new bull market may already be unfolding. While, understandably, downside risk typically gets the most attention, investors should also consider what the “upside risk” could be in the coming year if the “low is already in?”
The Power Of DISINFLATION
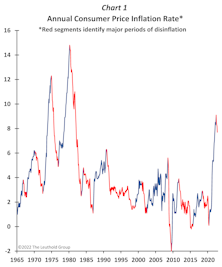
The debate surrounding “how long” U.S. inflation could remain elevated and how quickly or slowly it will return to “normal” is far from over. However, at the very least, it appears that inflation has peaked. During the last few months, the annual CPI, PPI, and wage inflation rates have declined noticeably and significantly from their respective cycle highs. Several concerns still need to be addressed. Will inflation persist at its current unacceptable level and require much more aggressive policy action? Could inflation expectations yet become unanchored? Is a recession inevitable? Or, now that we’ve seen the inflation peak, will conditions promptly return to normal?
Recession Resistance
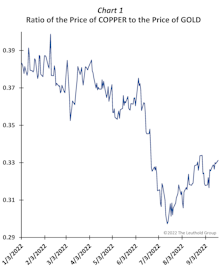
Inflation has been slowing for the last several months and finally appeared in the “headline” numbers last week. Although a single comforting CPI report will not eclipse ongoing concerns about inflation, leading up to that report, there was a broad array of evidence that inflation was moderating and has probably peaked—e.g., falling commodity prices, decelerating wage inflation, declining import and export prices, renewed deflation in the Adobe Digital Price Index, various private sources (like Costar and RealPage) illustrating that rents had decreased, a downturn in used vehicle prices, a complete collapse in shipping rates, and increasing numbers of retail price discounts due to inventory overhangs.
More Bond Buyers Than Bond Sellers?
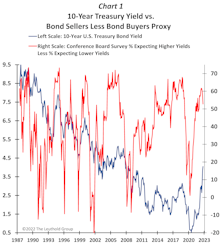
In August 2020, the 10-year U.S.-Treasury bond yield hit an all-time low of about 50 basis points. Since then, the primary problem for bond investors, understandably, has been “more sellers than buyers.”
Flat For Five?
The U.S. stock market has been ugly all year. Last week, with a Fed meeting and presser—surprise—the stock market had yet another LOUSY showing. Nonetheless, despite the Federal Reserve reiterating that the pain is far from over, investors should note that the S&P 500 has stopped falling. It might not feel like it, but after trending persistently lower during the first five-and-a-half months of 2022, the stock market has now been “Flat” for the last “Five.”
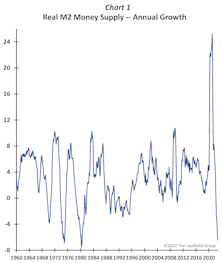
A Liquidity Pivot Is Nearing
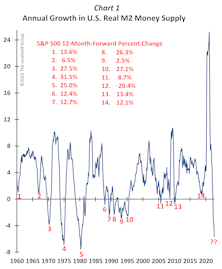
During the last 18 months, the U.S. economy and financial markets have been challenged by persistent declines in real liquidity growth. Slower real monetary growth—with a lag of one year or more—tends to moderate real economic growth, inflation pressures, and corporate profit expansion. In a more coincident fashion, stocks and bonds also struggle as liquidity becomes inadequate.
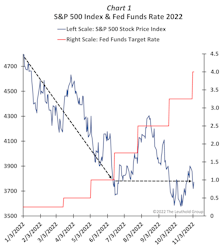
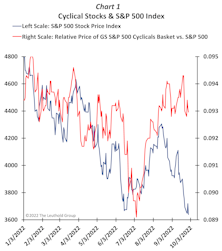
An INEXPLICABLE Stock Market
Since at least Jackson Hole, the narrative has been that inflation is a big problem, and the Federal Reserve was up for the fight—certifying it would raise interest rates quickly, substantially, and for a long time. Powell gave his “tough-love” speech on August 26th when the S&P 500 was at 4,200 and the Treasury yield was near 3%.
Fed Uncertainty And Investor Sentiment To Improve?
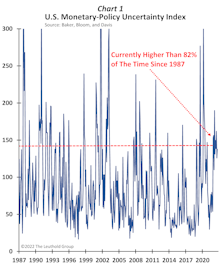
Not since the late 1970s has uncertainty surrounding monetary policy and the Federal Reserve been so pronounced. Of course, current anxiety about Fed actions is the direct consequence of the highest inflation in 40 years. Nonetheless, the aggressive and unorthodox policies enacted this year by the tough-talking and tough-acting Fed have led to some of the most pessimistic investor-sentiment readings in history.
Has The Stock Market Changed Its Stripes?
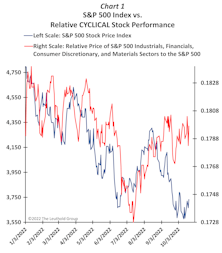
Until mid-year, inflation fears intensified, bond yields rose, the Fed raised the funds rate, and the stock market declined. Since mid-year, inflation fears have intensified, bond yields have risen, the Fed has persistently raised the funds rate… but the stock market stopped falling. The S&P 500 surged from its June lows, collapsed in August, and is now basically unchanged over the last several months.
A Fed Pivot, Or Does The Bond Market Blink First?
How much more and for how much longer will the Federal Reserve keep raising interest rates? Will a significant upturn in the unemployment rate stop them? A surprising drop in a headline inflation reading? Or will recent Fed actions “break” something, resulting in a financial shock? Who knows?
Stock Market Discounting Plenty Of “BAD”
Sentiment measures have been lousy most of this year. The CNN Fear and Greed Index is at 19—categorized as “extreme fear.” The AAII Bulls Less Bears indicator has been below -20 much of the year and is now at -31—lower than 98% of the time since its 1987 inception. The Investors Intelligence Bull/Bear Ratio, which tracks the market sentiment of financial advisors, is currently less than 1.0, illustrating panic. The 10-day moving average of the CBOE Equity Put/Call Ratio is higher than at any time since the March 2020 pandemic collapse. And, finally, the stock market’s “fear gauge”—the CBOE VIX Volatility Index®—has frequently been above 30 this year (as it is now).
Is The “Death” Of Profits Greatly Exaggerated?
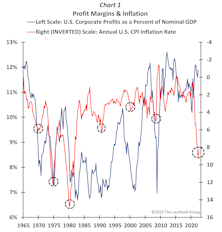
The lagged impact of an array of contractionary economic policies in place since early 2021—a severe deceleration in monetary growth, substantially less fiscal accommodation, a surge in the U.S. dollar, and significantly higher yields across the yield curve—is already slowing both real economic growth and inflation and will surely moderate profit growth. However, there is mounting apprehension that company earnings growth will not only diminish but collapse as the Federal Reserve pushes the economy into a recession.
Good News Which Is Still “Good News”
With overwhelming concerns about inflation, overheated economic growth, and Federal Reserve tightening, any good news is mainly perceived as “bad news.” Reports showing strong consumer spending, healthy industrial activity, better housing numbers, or solid job figures only raise fears that the Fed will be forced to lift interest rates higher for longer. It’s a tough environment for investors. Typically, evidence of “economic health” is a good thing. Until the Fed blinks, however, and inflation anxiety moderates, news that is ordinarily good will be “bad.”
Thoughts On The HAWK At The Helm

Over the years, I’ve never tried to “figure out” what the Fed would do. Rarely spent much time adding up the number of doves versus hawks comprising the board. Didn’t find much value in parsing “Fed Speak,” carefully examining changes in the minutes from the last meeting, trying to reconcile widely diverging opinions among the multiple speeches of current members, and certainly never did a deep dive into the dot plots. Turns out, that was a mistake!
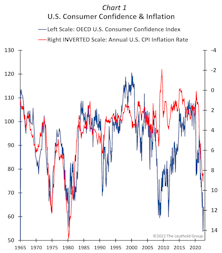
Confidence Is Cheap… Relative To Fear
What a year! Runaway inflation, surging bond yields, a rebirth of the Volcker Fed, a persistent bear market, widespread recession fears, a European War, and rising China/U.S. tensions. Not to mention—yet another booster shot, the passing of a 70-year-reigning Monarch, unprecedented heat, floods, fires, tornadoes, hurricanes, and, of course, mid-term elections in a country with massive political strife.
Yields Increasingly OUT OF BOUNDS?
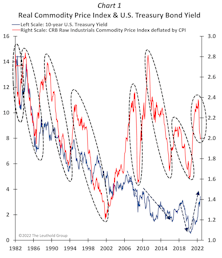
Yields have been on an upswing all year, and based on Federal Reserve comments, they may go up for the balance of 2022 and perhaps into 2023. Nevertheless, a host of factors suggest yields are getting more and more “out of bounds” with historical norms, and a “rate peak” is probably nearing.
Paulsen's Perspective Archive
Perception for the Professional
July 2026 Issue

Featured Articles
Sector Navigator
July 2026 Issue
