Utilities
Rate-Sensitive Groups Dominate Unattractive List
Utilities, Real Estate, and Consumer Staples are the bottom three sectors among the GS Scores.
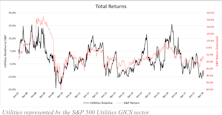
Utilities Sector: What’s Driving YTD Performance?
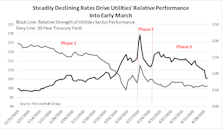
We review the somewhat out-of-character performance of the Utilities sector to try to pinpoint what is influencing results. This article touches on several potential drivers for the sector’s relative strength.
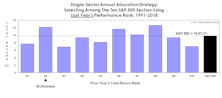
Low P/E Track Record
The “robustness” of the “Cheapest Sector Strategy” concept is illustrated by strong results across all rebalancing frequencies.
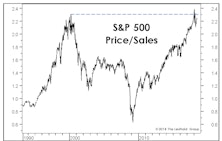
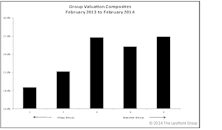
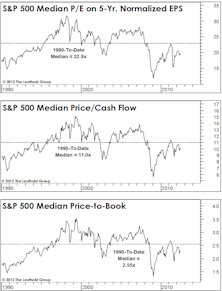
Utilities' Valuation Millstone
Even though the S&P 500 roared ahead by nearly 50% over the last three years, the traditionally low beta slow-growth Utilities sector outperformed during that powerful upswing. Nevertheless, today Utilities seldom look attractive by active managers and calls to overweight the sector are scarce.
Bridesmaid Strategy - Sectors
Our analysis of the Bridesmaid effect originated in 2006, but was based on S&P 500 sectors rather than asset classes.
Sector Rankings

Following a seven-month stint as the highest-rated sector overall, Consumer Discretionary relinquished the throne to Health Care.
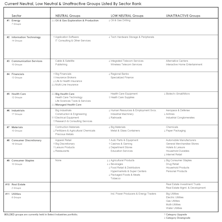
GS Score Sector Rankings With Attractive & Unattractive Rated Industry Groups

Consumer Discretionary can’t be topped; it has held on to the highest-rated spot for seven consecutive months. Utilities and Telecom continue to close out the bottom two.
Altitudes Are Too High— And Attitudes Are Getting There
An important feature of this bull market—and a reason for its longevity—is the slow recovery in investor attitudes relative to valuation altitudes...
Sector Rankings
Consumer Discretionary has held on to the highest-rated spot for six consecutive months. Coming in last (again) is Utilities. After rating among the lowest two positions between April 2017 and April 2018, Energy finally improved and now sits in 6th place—the middle of the pack.
The Yin And Yang Of Utilities
Are Utilities defensives, or are they interest rate plays, or both? We believe the driving influence fluctuates based on market conditions, specifically fear, and the desire for protection in down markets.
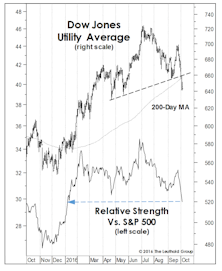
Long-Lagging Utilities Catch Up
For months on end, the Dow Jones Utilities has been the only bellwether group not to participate in the parade of new bull market highs.
January’s GS Score Sector Rankings

A summary table detailing the Attractive and Unattractive sectors and industry groups going into 2017.
Is The Crack In Utilities A Broader Market Warning?
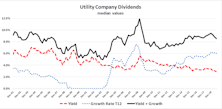
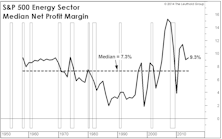
A few months ago, we mentioned the valuation risks that had built up in the stodgy Utilities sector, which at its mid-summer peak commanded a trailing P/E multiple of 24x—almost 10 points above its 1990-to-date median of 14.7x.
Bond Bubble Spills Into Equities
The S&P 500 once again remains on the verge of a new bull market high, thanks in large part to the bubble in another asset class: Bonds.
Is Defense Overpriced?
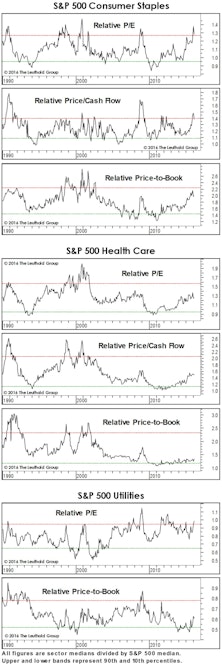
Relative valuations of Staples and Utilities sectors already reflect a “flight to quality” effect. Investors looking to add some economic/stock market defense should focus on the cheaper Health Care groups.
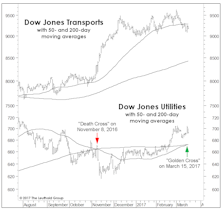
A BUY Signal That Says SELL?
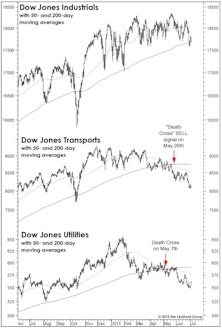
Last month we discussed the negative market implications of May’s “Death Cross” signals in the Dow Transports and Dow Utilities.
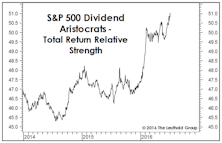
Beware Bond-Like Stocks
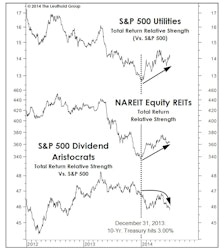
We certainly have nothing against dividends, but for more than a year we’ve believed that high-yielding themes like the Utilities, REITs, and the S&P Dividend Aristocrats have become so popular they’re likely to disappoint their new owners for a while.
Late March Reversal… And The First Shall Be Last
We examine the impact of March’s strong group leadership reversal on the top and bottom of our group model.
Profit Margins At The Sector Level
All ten of the S&P 500 sectors recorded a sequential increase in four-quarter trailing net profit margins. But consider where sector margins stand today relative to their 25-year medians. Eight of ten S&P 500 sectors are recording profit margins well above their long-term medians.
Group Models: Info Tech Tops Domestic, Financials Remain Atop Global
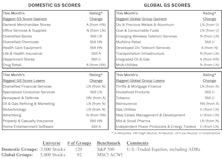
Both models have numerous Information Technology and Financials groups in Attractive territory. Neither model has any Unattractive Tech groups. Alternatively, neither model has any Attractive Utilities groups, while several Utilities rate Unattractive in each.
Group Models: Info Tech Tops Domestic, Financials Tops Global

Both models (particularly domestic) have a number of Attractive rated Information Technology groups and no Unattractive rated Tech groups. Financials’ domination of the Global Attractive range continues.
Sector Margins: Just Thank The Consumer
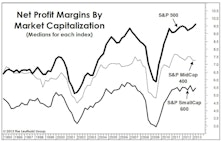
We’ve noted before that profit margin gains since the technology boom have been primarily a Large Cap phenomenon.
Is The Dividend Mania Ending?

The list of new lows is dominated by yesterday’s darlings, “bond-like” stocks. In particular, Utilities and REITs have been hammered. However, not all of the stock market’s high yielders have been trashed.
Key Observations On Q2 S&P 1500 Earnings

Year-over-year EPS growth rate for companies with Q2 reports (with about 65% in) currently stands at +4.2%, while revenue growth has come in at a better than expected +2.6%.
Group Models Agree On Energy & Materials
But Information Technology rises to the top of the Domestic model, while the trend of Financials domination in the Global model remains intact.
Domestic and Global Group Models: Strong Agreement On Financials
Our Domestic Scores have five Financials groups rating Attractive; these same five industry groups are Attractive in our Global model. In total, seven Financials groups rank Attractive in the Global model, with insurance groups looking particularly Attractive.
A Look At Thematic And Sector Valuations
Health Care and Consumer Staples valuations don’t look as dangerous as widely assumed. Utilities look expensive; conversely, the big corrections in the Industrials and Materials sectors have yet to create truly compelling valuations. The best sector for contrarians is Energy.
Client Questions

Here again are some of the client queries we have had over the last month.
The Metamorphosis
Many have now come to recognize the monumental cash flow metamorphosis taking place with many utilities. For well over a decade the utility industry had been chronically short of capital, a condition requiring massive new debt financing and equity financing (often well under existing book values). Today many utilities have become impressive net cash generators, throwing off cash far in excess of projected capital investment requirements.
Utility Cash Cows…..Our Cash Cows in Confinement

Herein we present statistical tables of 46 public utilities that qualify as potential cash cows with cash flow now exceeding capital expenditures. We also isolate and grade the 24 utilities that we think look the best, explain the investment rationale in more detail and review the important factors investors should consider.
Cash Cows on the Loose…..and Cash Cows in Confinement

The “Cash Cow” theme Is divided into two parts. “Cash Cows on the Loose” are big cash generators that are immediate takeover or buyout candidates, and “Cash Cows in Confinement” are large free cash generating regulated utilities. Both categories are added to the model this issue. The use of regulated utilities may be a surprise to most readers.
Perception for the Professional
March 2026 Issue

Featured Articles
Sector Navigator
March 2026 Issue
