Yields
The Case Of The Missing “Puts”
In the last few months, we’ve warned that Wall Street’s favorite security—the Federal Reserve Put—has been at least temporarily replaced by a novel derivative with a less favorable risk/reward profile: the short Fed call.
Stocks In The Face Of Rising Yields
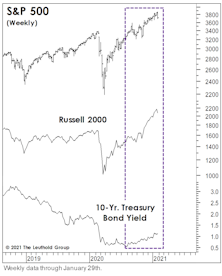
With yields on the 10-Yr. Treasury finally breaking above 1.00% last month, the consensus has quickly evolved to the view that stocks and yields can continue to rise alongside one another for a while. Small Caps have shown a decisive performance edge during the recent episodes.
Minding The “Middle”
When investors ponder the level of yields that might pose a problem for stocks, it’s invariably the U.S. 10-Yr. Treasury bond that’s referenced. That’s fine, but the middle part of the Treasury curve has had just as strong a relationship with stocks, historically, as have longer-dated bonds.
Super-Rarified Air
The 2020 post-election stock surge looks and feels a lot like the 2016 “Trump Bump.” But, of course there’s a spoiler. The Biden Bump started with a Normalized P/E level about 30% higher than the one prevailing on election eve of 2016 (26.8x versus 20.5x, respectively).
Better Than Bonds And An All-Time Record
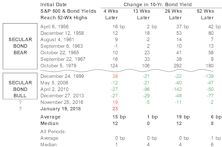
The collapse of U.S. Treasury yields and the simultaneous end of the bull market has produced a new all-time record for the S&P 500, albeit under less-than-desirable circumstances.
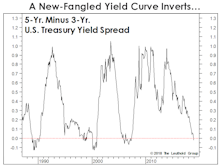
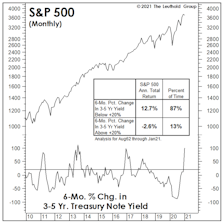
Deep-Six The “Threes-Fives”
We’ve sometimes called the yield curve our “favorite economist,” so we were amused when some enthusiastic data miner in the Treasury market tried to slip us a cheap imitation in late November.
A Near-Perfect Model You Should Ignore
We somehow missed this signal in January, perhaps because we were pre-occupied with so many other signs of “climate change.”
Millions Of Citizens Become “One-Percenters…”
While the collapse of Swiss government bond yields into negative territory was January’s bond market stunner, our “G7” composite 10-year government bond yield reached its own milestone when it closed the month below 1.0% for the first time in post-WWII history.
Current State Of Stock-Bond Relationship = “Easing”
We define four states of the stock-bond relationship based on the directions of stock price and bond yield movements; stocks fear tightening more than true risks, while bonds are more responsive to Risk-On and Risk-Off.
Economic Outlook
Bond yields have declined 40-55 basis points in the past three months.
Economic Outlook
GDP growth of 4.0% projected for 2004. Improved 2004 budget deficit projections a short term positive for bonds but eventually could be a negative.
Bond Market Summary
Rising stocks and still good economic news make third Fed boost likely.
Bond Market Summary
New inflation fears and strong economy contributing to higher yields. Fed may tighten in coming months to slow down this high powered economy.
Inflation Update
Wage inflation looked like it was finally taking off in October, but November's data showed a different picture, as four of the nine subsets (including Total Wage inflation) moved lower.
Interest Rates: Historical Perspective
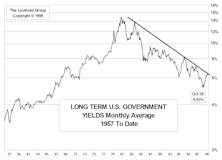
Today, T-bills are yielding 3.20% and high quality commercial paper is yielding 3.40%. It may be useful to examine these rates in a historical perspective. Some may think these are just about the lowest short term rates in U.S. history. Well, not quite.
Comparing Common Stock Cash Flow Yields to Bond Yields
We thought last month might be the end of this bond/stock comparative series. However, a recent note from a client has prompted us to undertake an additional study comparing common stock cash flow yields with bond yields.
Common Stock Dividend Yields and DJIA 3000
In this “In Focus” feature, 103 years of common stock dividend yields are compared. Today’s prevailing yields are put in historic perspective. Then various future stock market models are constructed, employing a variety of future earnings and dividend growth rates. Considering dividend yield history, the “super bulls” target of DJIA 3000 before the end of the decade seems close to impossible.


.jpg?fit=fillmax&w=222&bg=FFFFFF)
