10-Year
Limbo Rock!
As global rates have taken a precipitous dive the last few months, it’s been hard not to hum “Limbo Rock.” And just like Chubby Checker, we’ve been asking our screens “How low can you go?” on a daily basis.
Same As It Ever Was?
February’s Oscar win validated our efforts to make the ‘Green Book’ suitable for all audiences, like our decision to relegate “bottom-quartile” valuation outcomes to the very back of the publication.
The Market Is Off Its Meds!
While investors obsess over the market level at which a hypothetical “Powell Put” might come into play (or whether such a put even exists), they seem to have overlooked the absence of another such put that proved dependable throughout the cyclical bull market.
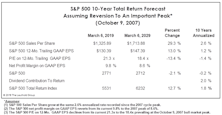
“Unlevered” Treasuries Aren’t A Bubble
It’s been popular to argue that U.S. government bonds are a bubble while U.S. equities are not. But even if we agreed, the potential cyclical total return losses in Treasury bonds are a fraction of those likely to occur in an equity bear market.
What The Curve Does And Doesn’t Tell Us
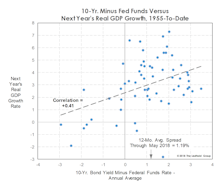
The gap between the 10-year Treasury yield and the federal funds rate has narrowed sharply in the last year but remains a long way (~110 basis points) from inverting.
A “Busted” Bond BUY Signal
Last October our VLT algorithm recorded a bond BUY signal—one that we said, at the time, conflicted with our outlook.
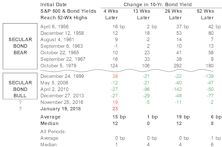
The Bear Market No One Discusses
.jpg?fit=fillmax&w=222&bg=FFFFFF)
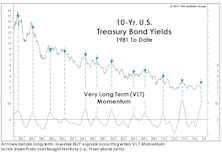
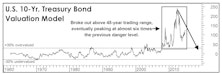
Yields on 10-year Treasury bonds have still not breached the 3.00% level that many believe will stick the proverbial “fork” in the secular bond bull market that began in 1981. That could well in happen in the next few weeks, but we believe it’s important to step away from the daily fray and reflect upon the damage that’s already been done.
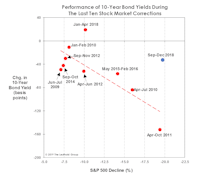
A “Drug-Free” Market Decline?
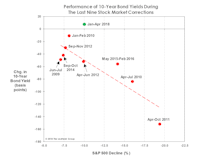
Yields on 10-year Treasuries are up 10 bps since stocks peaked in January, a clear break from the behavior of prior corrections. The last four stock declines of 10%+ were self-medicating—having been accompanied by bond yield declines of 50 to 150 basis points.
A Near-Perfect Model You Should Ignore
We somehow missed this signal in January, perhaps because we were pre-occupied with so many other signs of “climate change.”
1987 Parallels (Part 2)
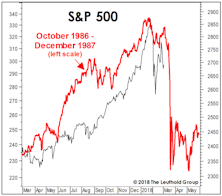
At the risk of yelling “fire” in a crowded theater, we present a few parallels between recent action and the year leading up to the October 1987 crash.
What Yield “Kills” The Secular Bond Bull?
Bond market strategists remain hell bent on identifying the key yield level on 10-year Treasuries at which one can finally declare an end to the 1981-20XX secular bond bull market.
Will Rates Kill The Low Vol Mania?
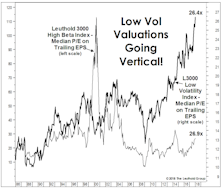
While there are many parallels between recent action and that of 1999-2000, stock market leadership is not one of them.
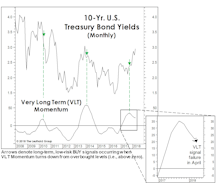
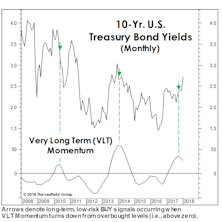
… Yet Another Bond BUY Signal?
The implication from VLT Momentum is that bonds are sufficiently oversold (or, equivalently, that yields are sufficiently overbought) to trigger some degree of mean reversion over the next several months.
A Mysterious Bond BUY Signal…
Sometimes we feel compelled to report findings that conflict with our outlook. And then there are the even rarer times we actually do it.
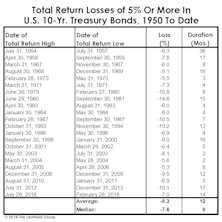
Bonds: No Pain, Yet No Gain
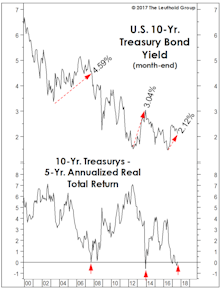
We find it remarkable that the five-year trailing real return on Treasurys has dropped to zero without investors having (yet) suffered any real pain.
Spoiler Alert! The Bond Bear Is Already Here...
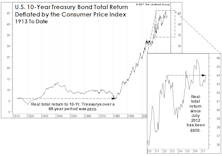
Bond investors residing in the Lower For Longer© camp no doubt feel vindicated by the summer rally that’s taken yields on 10-year Treasury bonds to as low as 2.06% in early September.
Stocks Versus Bonds: A Lonnngggg-Term View
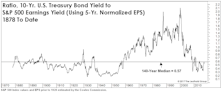
On a 50-year view, stocks do indeed look cheap relative to bonds. But the inclusion of 90 earlier years of data muddies the message.
“Teflon” Bonds—The Donald Trump Of Investments
Throw anything at them and bonds can shake it off. The multi-decade march toward ever-lower yields seems unstoppable, not even by the zero line.
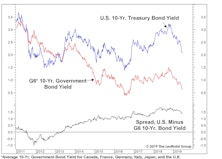
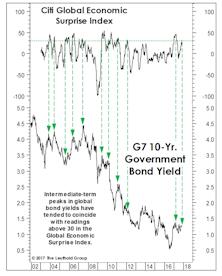
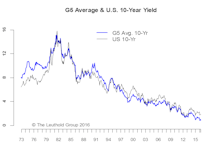
New Bond Market Record: G5 10-Year Average Hit All-Time Low
Despite the improvement in market sentiment, U.S. bond yields were dragged lower by their international counterparts.
A BUY Signal That Says SELL?
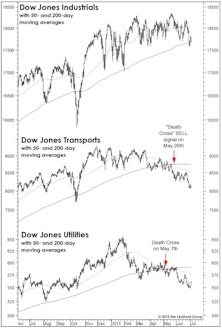
Last month we discussed the negative market implications of May’s “Death Cross” signals in the Dow Transports and Dow Utilities.
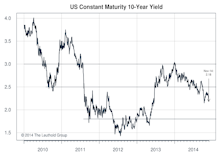
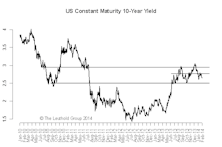
U.S. 10-Year: Not All In Sync
· The higher-highs/higher-lows pattern since the 10-year yield trough in January is encouraging but the bigger test is the 225-230 area.
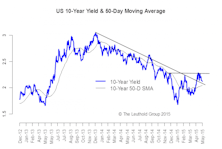
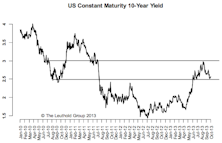
U.S. 10-Year: Many Reasons To Be Patient
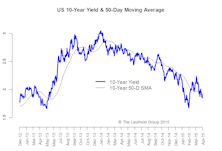
From a price action perspective, the drop below the 50-day moving average and the failed higher-high, higher-low pattern are not supportive of an imminent up-turn in interest rates.
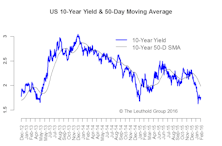
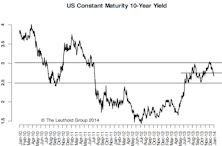
U.S. 10-Year: Looking For A Follow-Through
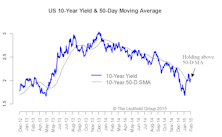
This is the first time in the last year or so the 10-year yield has broken through, re-tested, and held above the 50-day moving average.
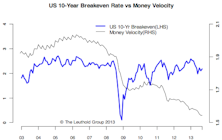
U.S. 10-Year - All About Inflation
The collapse in oil prices has brought down inflation expectations dramatically. Inflation will likely be the single most important driver of interest rates in the next 6-12 months.
What To Do With Broken Models?
With the quantitative horsepower now available at the fingertips of even the most technophobic portfolio manager, there’s little tolerance for any model that finds itself out of sync. But “broken” models (and especially value-based ones) have an eerie way of reasserting their relevance just after they’ve been finally tossed to the trash heap.
Interest Rates Range Bound—Can’t Be Too Bearish
The sell-off in risky assets in early October promptly led to expectations of a more dovish Fed.
10-Year Yield: 250-280 Range Intact
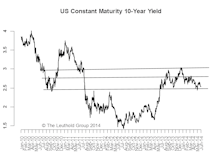
As we expected, at 250-270, the 10-year yield stayed within our narrow target range in June.
10-Year Yield: Back in 250-280 Range
In the very short term, excessive bearish positions have been reversed so there is less downside pressure on interest rates. Over the intermediate term, incredibly low yields in the Euro-zone help cap the U.S. yield.
U.S. 10-Year: 245-250 Area A Strong Barrier
We expect the 245-250 area, the upper bound of the previous lower range, to be a strong barrier.
A Taper & Hibernating Bears

The rise in interest rates after the taper was on the back of low liquidity around the holidays. 3% is a pretty strong upper bound for the 10-year, and a failure to stay above this level will probably see a re- test of the 275 level in the near term.
10-Year: No December Taper, Back To The 250 Level
Given our assumption of no December taper and the fact that most of the recent rise in interest rates is due to an early-taper fear, we expect the 10-year yield to drop back to the 250 level.
The Dual Mandate Presents A Clear Dilemma For The Fed
The “dual mandate,” which means the Fed is paying close attention to both inflation and employment, presents a clear dilemma for the Fed when it comes time to decide on a taper.
10-Year: Year-End Target Still 250 BPS, Interim Volatility Expected
We don’t think the numbers between now and the Fed’s December meeting will be strong enough to convince it to start tapering this year. No taper until 2014, in our opinion.
Debt Ceiling—Weakness Before But Strength After Resolution
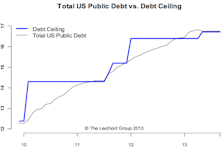
A look at prior debt ceiling debates and patterns around resolution dates gives no surprises: markets are weaker in the two weeks before but stronger in the month after a resolution is reached.
No Taper—More Downside Likely On The 10-Year & Higher Volatility Ahead
A look at prior debt ceiling debates and patterns around resolution dates gives no surprises: markets are weaker in the two weeks before but stronger in the month after a resolution is reached.
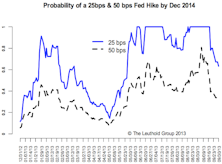
Data Dependency—September Taper Still Likely
More upside surprises are still likely and, despite the disappointing jobs report, the overall economic picture still supports a September taper. The improving economic picture is not just happening within the U.S., but in other major countries. We still believe the upside for the U.S. 10-year is limited.
10-Year: Taper the Taper—Upside Limited
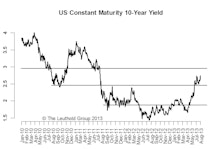
If interest rates keep going higher from here, we would run the risk of derailing a still-fragile recovery. As long as the Fed tapering uncertainty exists, we expect higher volatility on the 10-year yield to persist in the mean time.
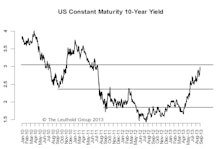
10-Year Still Range Bound Between 185-245 But Expect Higher Volatility
We think the 10-year yield will likely consolidate around 200-215 before taking a shot at 245. The 245 level looks like a strong barrier and will likely hold in the foreseeable future.
Perception for the Professional
March 2026 Issue

Featured Articles
Sector Navigator
March 2026 Issue
