5-Year Treasury
The Yield Curve Meets Microsoft Excel
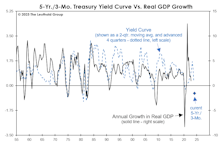
To our surprise, the measure that most closely correlated with real-GDP growth on a one-year time horizon is the rarely mentioned Treasury spread for the 5-Yr./3-Mo.
Which Yield Curve?
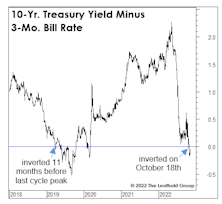
Last month’s inversion in the 10-Yr./3-Mo. Treasury spread further tilts an already lopsided scale in favor of a U.S. recession in 2023. That spread has been considered the gold standard from an economic forecasting perspective, and is the basis for the New York Fed’s Recession Probability estimate (which, by the way, should break above its critical 35% threshold when it’s published later this month.)
Minding The “Middle”
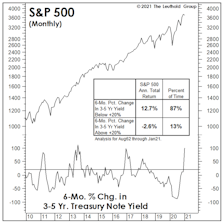
When investors ponder the level of yields that might pose a problem for stocks, it’s invariably the U.S. 10-Yr. Treasury bond that’s referenced. That’s fine, but the middle part of the Treasury curve has had just as strong a relationship with stocks, historically, as have longer-dated bonds.
Deep-Six The “Threes-Fives”
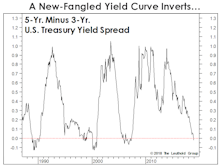
We’ve sometimes called the yield curve our “favorite economist,” so we were amused when some enthusiastic data miner in the Treasury market tried to slip us a cheap imitation in late November.
Perception for the Professional
March 2026 Issue

Featured Articles
Sector Navigator
March 2026 Issue
