Bond Yield
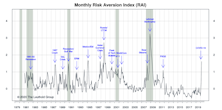
Something BAA-d Brewing?
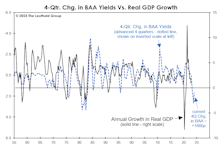
Tightening peaked in Q4-2022, with the BAA yield at 266 bps above its year-earlier level—the most contractionary move since the early 1980s. If the standard lead-time applies, the full impact will be felt in Q4-2023.
A 2% Yield Is Higher Than You Think

Prior to the Russian invasion of Ukraine, 10-year Treasury yields bumped above 2% for the first time since July 2019. While that level may strike seasoned investors as insanely low, a 2% yield is now within a few basis points of the ten-year moving average of 2.04%.
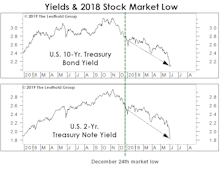
The Market Is Off Its Meds!
.jpg?fit=fillmax&w=222&bg=FFFFFF)
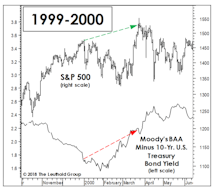
Well before the war drums in Eastern Europe began to beat, this stock market correction had already been marching to a different beat. The market’s confusion might be understandable, because—unlike during most of the post-GFC corrections—it has so far failed to “self-medicate!”
A persistent feature of stock market declines in the past 13 years has been that they have typically triggered a simultaneous falloff in bond yields.
That Money Tsunami Is Now Just A Flood
Compare the U.S. monetary response in early 2020 to China’s: The Fed quadrupled the M2 growth rate (from 6% to 24%) in three months, while China merely bumped M2 growth from 8% to 11%. This relative policy restraint leaves China in a better position to handle potential fallout than if it had gone “all in” like the U.S.
Smarter Than The Bond Market?

The half-percentage-point drop in the 10-year Treasury yield, since mid-March, has investors worried about “what the bond market might know” that the stock market doesn’t. Maybe it’s time to stop lionizing the bond market’s prescience and give the stock market its due.
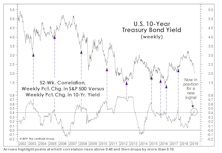
Stock/Bond Disconnect?
.jpg?fit=fillmax&w=222&bg=FFFFFF)
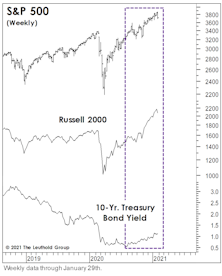
In the May Green Book, and again in the May 21st issue of “Chart of the Week,” we discussed the trailing one-year correlation between weekly percentage changes in the S&P 500 and the 10-year Treasury bond yield. Rollovers from high levels in this correlation have signaled most of the important pullbacks in the bond market over the last 20 years.
Inflation: Nothing To Fear But The “Lack Of Fear”
The refusal of the bond market to acknowledge the worsening inflation readings seems to have strengthened the consensus view that any inflation trouble will be “transitory.” Do bonds still know best when there’s a systematic, price-insensitive buyer hoovering up $120 billion of them per month?
Real Yields: Interesting, But Not So Helpful
.jpg?fit=fillmax&w=222&bg=FFFFFF)
After Consumer Price Inflation spiked to a 12 1/2-year high of 4.2% in April, there’s been a torrent of analysis decrying the collapse of “real yields”—including the real Treasury-bond yield, real S&P 500 dividend yield, and even the real S&P 500 earnings yield. Since all of these yields already traded at extremely low nominal levels, the inflation adjustment makes every one of them look even worse. For example, the real yield on 10-year Treasuries just sunk to -2.60%, the lowest reading since 1980 (Chart 1).
What The Two-Month Stall In Bond Yields Tells Us
.jpg?fit=fillmax&w=222&bg=FFFFFF)
The 10-year Treasury yield has absorbed the past two months’ worsening inflation numbers by going exactly “nowhere.” Bond investors seem to be all-in on the Fed thesis that the inflation pickup is just transitory.
During the recent consolidation, however, the Treasury yield showed a subtle change in character—one that suggests there might be more inflation paranoia than meets the eye. The 10-year yield’s daily correlation with stock price movements flipped negative, and then plummeted toward a 21-year low.
Two More Reasons For Yields To Rise
Bond yields have paused in the last several weeks, but we think it’s likely to be a pause that “refreshes.” Many bond indicators, including the Copper/Gold ratio popularized by Jeffrey Gundlach, suggest yields should be moving dramatically higher in the months ahead.
Stocks And Yields Revisited
.jpg?fit=fillmax&w=222&bg=FFFFFF)
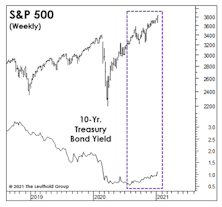
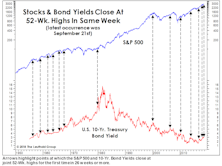
The S&P 500 and 10-Year Treasury bond yield could accomplish something fairly rare today by closing at “joint” 52-week highs. The relevant levels to meet or exceed are 3934.83 on the S&P 500 and 1.49% on the bond yield.
Bond Yields “Take Down” An Old Favorite

The “lower for longer” interest-rate thesis propped up the S&P 500 Low Volatility Index for more than a decade. Rising bond yields have since helped drive this former darling to an 18-year relative-strength low. Yet, assets in the S&P Low Volatility ETF are still five-times larger than its High-Beta counterpart.
Stocks In The Face Of Rising Yields
With yields on the 10-Yr. Treasury finally breaking above 1.00% last month, the consensus has quickly evolved to the view that stocks and yields can continue to rise alongside one another for a while. Small Caps have shown a decisive performance edge during the recent episodes.
Minding The “Middle”
When investors ponder the level of yields that might pose a problem for stocks, it’s invariably the U.S. 10-Yr. Treasury bond that’s referenced. That’s fine, but the middle part of the Treasury curve has had just as strong a relationship with stocks, historically, as have longer-dated bonds.
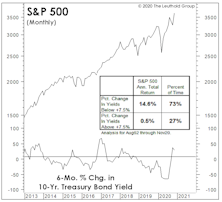
Rising Rates And Rising Stock Prices?
Often, what market pundits like to pass off as bold, contrarian forecasts are merely rationalizations and extrapolations of trends that have already been in place for some time.
Heating Up Quickly
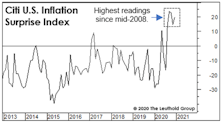
Inflation surprises have run hotter in the U.S. than in the rest of the world, no doubt reflecting the strength of major currencies versus the U.S. dollar.
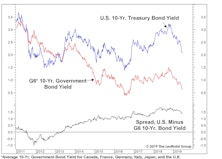
Bond Yields: Cyclical Pressures Vs. Positioning
.jpg?fit=fillmax&w=222&bg=FFFFFF)
Even after watershed events COVID-19 and MMT, some things never change.
Next year will begin like almost every one of the past dozen years, with economists and strategists expecting bond yields to rise.
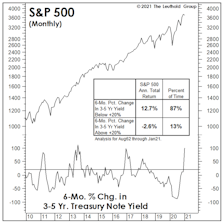
Unlike most of those years, though, there are several measures of “cyclical pressures” that would seem to give them a good chance of being right. The best-known among these might be the “Copper/Gold Ratio,” popularized by DoubleLine’s Jeffrey Gundlach, which suggests 10-Yr. Treasury yields should be around double their current level (Chart 1).
High Tide?
For almost nine months, an historic Fed liquidity flood has washed away any economic, valuation, technical, or “sentimental” stock market challenges. Nonetheless, each economic disappointment brings hope this flood will intensify. Those hopes aren’t irrational, because when it comes to any measure of liquidity, rate of change is more important than level.
Five Reasons To Expect Higher Yields

Much of what we think “we know” about the bond market says yields should be headed higher.
Remember The Yield Curve?
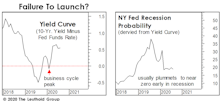
It would be a mistake to ignore (as most pundits will) this important forecasting tool until the next time it threatens to invert. The level and direction of the yield curve provide helpful information throughout the entire economic cycle.
Inflation In The Wrong Places?
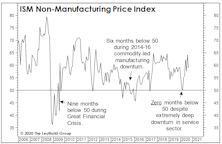
Long before policymakers’ extreme response to the COVID collapse, we feared that the Fed’s interventions were suppressing important signals from the stock and bond markets. But we now suspect that hyper-expansionary policies are suppressing price signals from the “real” economy as well.
It’s Demographics, Stupid! (Not The Economy.)
_Page_1.jpg?fit=fillmax&w=222&bg=FFFFFF)
Turn on financial television at any random time, and you’re likely to soon hear the argument that still-high U.S. stock market valuations are “justified” by extremely-low interest rates. We’ve countered that these low U.S. rates are simply a reflection of the secular slowdown in economic and earnings growth.
A Cross-Asset Dash For Cash
March’s mad dash for cash didn’t stop with rates/credit/FX markets. Among equities, there was also a strong preference for cash liquidity. The market rewarded companies that had strong cash positions and punished those without—which explains why traditionally defensive styles actually underperformed.
Low Rates Don’t Justify Higher P/E Ratios (And U.S. Investors Should Be Glad)

The fear (or hope) that U.S. bond yields would fall to zero or below subsided over the last month. However, the belief that low yields merit significantly above-average P/E ratios remains stronger than ever.
Correlations Are Worthless, Except This One
We’ve never understood investment quants’ desire to project correlations among assets. Such correlations are inherently unstable.
Limbo Rock!
As global rates have taken a precipitous dive the last few months, it’s been hard not to hum “Limbo Rock.” And just like Chubby Checker, we’ve been asking our screens “How low can you go?” on a daily basis.
Take A Closer Look At “Goldilocks”
We’ve frequently written of the uncanny parallels between the rallies of 2018-19 and 1998-99, but hope that newer readers don’t mistake this analysis as a forecast.
Where Are Yields Headed? Look In The Mirror!

Many economists believe U.S. economic growth will reaccelerate in the second half, sending 10-year Treasury bond yields back above 3% late in the year. A forecasting technique with an excellent record, however, suggests the return to 3% won’t occur until late next decade!
What Are Bonds Telling Us?
Corporate bonds aren’t the only asset reluctant to embrace the stock market’s latest “all clear” verdict on the 2019 economy.
Credit Conundrum
The stock market seems to have concluded that a recession will be averted in 2019, but evidence from other asset markets is less convincing.
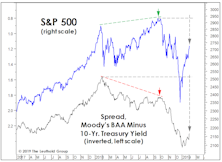
The Market Is Off Its Meds!
While investors obsess over the market level at which a hypothetical “Powell Put” might come into play (or whether such a put even exists), they seem to have overlooked the absence of another such put that proved dependable throughout the cyclical bull market.
3% Yields Proved To Be High Enough

In September the popular claim was that “interest rates were rising for the right reasons,” and still too low to threaten stocks or U.S. economic expansion.
Bond Yield Proxy—A Tool For Equity Investors

We created an equity basket that can track the movement of the U.S. 10-year yield. Overall, it does a good job of capturing the major moves.
Rates Hurting Households
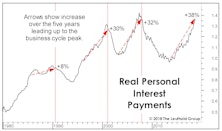
Doubling of yields since 2016 has slammed households. Percentage increase in rates is more important than the absolute level.
Bond Investors Get It Right Again!

Having devoted all of our professional lives to the monitoring and modeling of equity markets, we’re naturally ticked off that this year’s best stock market signals have in fact been rendered by bonds.
Measuring The Backup In Bond Yields

A couple of months ago, we (belatedly) observed that, in February the 10-year Treasury yield had bro-ken above its 10-year moving average. That simplistic tool has been a pretty good descriptor of yields’ long-term trend for more than a century, with few “whipsaw” signals along the way.
BAA Acting Baaaadly!
Whether or not they’ve risen for the “right” reasons remains up for debate, but the upward move in interest rates has hit the usual suspects very hard in 2018, like early-cycle industries and Emerging Markets.
Stocks Not Yet Yielding To Yields
Regardless of how it’s measured, the liquidity available for global stocks continues to run off.
New Highs In Stocks Have Some Unwanted Company
.jpg?fit=fillmax&w=222&bg=FFFFFF)
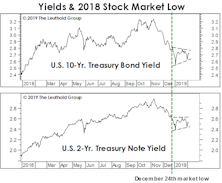
In recent commentaries, we’ve highlighted the surprising number of U.S. stocks making 52-week lows on both a daily and weekly basis, a sign that the market’s push higher has become more fractured. While pondering the significance of those lows, however, we missed a new 52-week high last Friday in a series we think will be especially critical to the stock market’s near-term fortunes: the 10-year U.S. Treasury bond yield. Specifically, the yield matched its weekly closing high of 3.07% posted on May 18th.
Another Eulogy For The Bond Bull

In the past year, big-name bond gurus have put forth various yield targets that, if exceeded, would provide definitive proof that the secular bull market in Treasury bonds begun in 1981 had finally ended.
Perception for the Professional
September 2025 Issue

Featured Articles
Sector Navigator
September 2025 Issue
