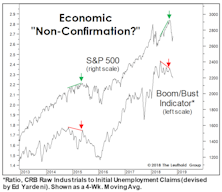
Boom/Bust Indicator
Looking “Bustier?”
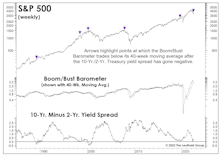
Key indicators are indeed trending in “pre-recessionary” fashion. Among them is the ISM New Orders Index, which dipped into contraction territory in June while inventories increased. Others are the JOLTS that shows a strong (but weakening) labor market, and unemployment claims—which have ticked up.
If Inflation Has Peaked, Thank The Stock Market—Not The Fed
.jpg?fit=fillmax&w=222&bg=FFFFFF)
High inflation continues to dominate the headlines, but it is only one piece of the “weight of the evidence” that’s stacked against the stock market. Still, in ironic fashion, stock-market action itself suggests that inflation is set to peak.
A Long Boom, And The Ultimate Bust
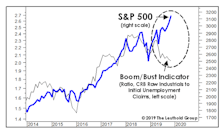
Last December, we marveled at the disconnect between the (surging) S&P 500 and the (sagging) Boom/Bust Indicator. Just six months later, we can only scratch our heads at what the hell we were complaining about.
Waiting For The Stimulus To Trickle Down...
Last year the Federal Reserve dumped historic stimulus onto a full-employment economy and an already richly-valued stock market. The stock market obviously loved it.
More Trends We Don’t Find Friendly…
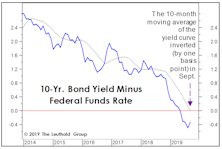
The yield curve’s ten-month moving average inverted in September, hence the yield curve inversion can no longer be dismissed as transitory; the Boom/Bust Indicator remains below its descending 10-month moving average, confirming economic weakness predicted by the yield curve; and, the “Present Situation” component of September’s Consumer Confidence survey slipped below its 10-month moving average for the third time in 2019.
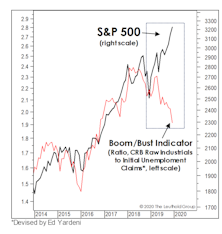
Bust To Boom, And Back Again
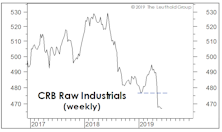
Last month, we observed that crude oil was the only item propping up broad-based commodity indexes, and that something was bound to give with the U.S. dollar pushing to new highs.
Non-Energy Commodities Signal A Major Slowdown
.jpg?fit=fillmax&w=222&bg=FFFFFF)
Late in the cycle, blue chip indexes like the DJIA and S&P 500 can fool investors by hiding subtler deterioration in the broad list of stocks. That’s been underway in the last couple of months, but it’s nothing in relation to the divergence that’s opened in the commodity market, where there’s an almost 20% YTD performance gap between the headline S&P/GS Commodity Index and its non-Energy components (Chart 1).
Too Soon To Expect Economic Weakness?
We believe stocks have begun to discount a major inflection point in the economy and corporate profits for 2019 and 2020.
Perception for the Professional
March 2026 Issue

Featured Articles
Sector Navigator
March 2026 Issue
