BUY Signal
Small Caps: Unresponsive
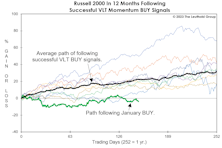
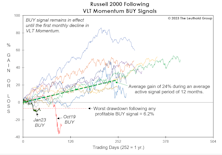
Based on successful Russell 2000 VLT BUY signals, 1982-forward, the index had gained an average of 23% eight months later—and none had a losing position. Since the VLT BUY on January 31st (eight months ago), the Russell 2000 has dropped 3.9%. Furthermore, Small Caps bottomed 15 months ago, and in a normal cyclical bull market, the Russell 2000 would be up 50-70% by this time.
VLT: You Read It Here Last
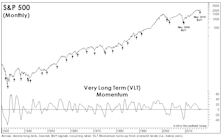
We anticipated it for months, and now that it has finally happened, we’re burying the news in the final page of this section. Yes, the last day of March saw the S&P 500 trigger a “low-risk” BUY signal on our Very Long Term (VLT) Momentum algorithm, known elsewhere as the Coppock Curve.
Heating Up Quickly
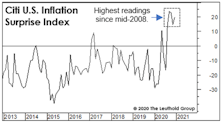
Inflation surprises have run hotter in the U.S. than in the rest of the world, no doubt reflecting the strength of major currencies versus the U.S. dollar.
VLT’s Struggles Are Telling Us Something
Our Very Long Term (VLT) Momentum algorithm has been a very good “confirmatory” market tool over the years, especially at the onset of a new cyclical bull market. But VLT has proven to be of little to no value in navigating this year’s gyrations. VLT’s latest flip-flops reinforce our view that the market leaderboard is set to be rearranged.
A “Low-Risk” BUY?!?
So what do we make of July’s “low-risk” VLT BUY signal on the DJIA—the index on which the indicator’s creator (Sedge Coppock) did his original work? Sadly, not much.
The High/Low Says “Buy High!”
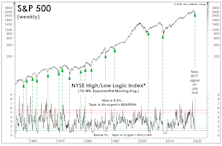
We’ve written periodically about the likely distortion of market breadth figures resulting from High Frequency Trading, the domination of ETFs, and (we believe, most importantly) the decimalization of stock quotations. Our concerns led us to expand our technical arsenal, and one of the gems we uncovered in that process was the High/Low Logic Index (HLLI).
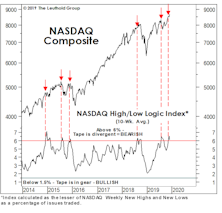
How To Tell When Sellers Are “Exhausted”
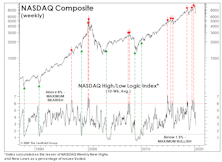
NASDAQ was the superstar of the bull market yet, ironically, it was a NASDAQ breadth measure that periodically signaled that all was not well beneath the market’s surface.
More Good News For Small Caps
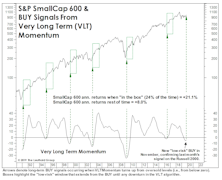
Our call for improved relative performance in Small Caps received another boost in November, when VLT Momentum for the S&P SmallCap 600 confirmed the prior month’s “low-risk” BUY signal on the Russell 2000.
A Tough Tape To Read
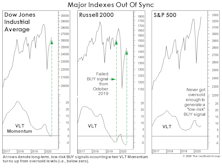
Over the nearly two years since the stock market’s “momentum” peak in January 2018, the S&P 500 has gained less than 9%, while the Value Line Arithmetic Composite is unchanged. Mid Caps and Small Caps have made no upside progress during this period and most foreign markets are down.
Not Much “Lift” From VLT “BUY”
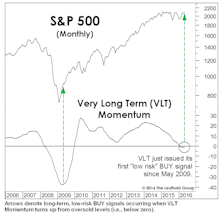
In the June Green Book, we professed some skepticism surrounding the long-term, “low-risk” BUY signal for stocks that was triggered at the end of May by our Very Long Term (VLT) Momentum algorithm (also known as the Coppock Curve).
VLT Says “BUY”
Breadth underlying the 4-month upswing has been stronger than that observed during any other rally leg since 2013. Despite just a 14% correction in the S&P 500 from its peak, a new VLT “BUY” signal was triggered. Failed signals are relatively rare, the last one occurred in December 2001.
A Turn In Leadership?
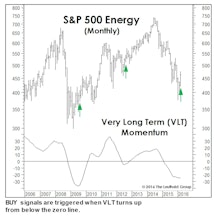
Last month we wrote that a big March gain would trigger a Very Long Term (VLT) Momentum BUY signal on the S&P 500 (Chart). The month’s 6.8% S&P 500 gain wasn’t quite enough to do the trick, but we’re intrigued that VLT did issue BUY signals for three of the market’s cyclical sectors, including Energy, Materials, and Industrials.
VLT Flashes A BUY On Oil
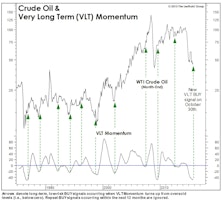
As expected, our VLT Momentum algorithm triggered a “low-risk” cyclical buy signal on crude oil in late October, only the 11th buy signal in the past 30 years. This algorithm was originally designed to identify low-risk entry points into the stock market, but we’ve found it useful with other assets as well.
Perception for the Professional
March 2026 Issue

Featured Articles
Sector Navigator
March 2026 Issue
