Correlations
The Yield Curve Meets Microsoft Excel
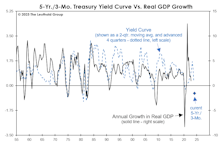
To our surprise, the measure that most closely correlated with real-GDP growth on a one-year time horizon is the rarely mentioned Treasury spread for the 5-Yr./3-Mo.
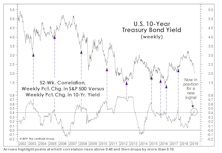
What The Two-Month Stall In Bond Yields Tells Us
.jpg?fit=fillmax&w=222&bg=FFFFFF)
The 10-year Treasury yield has absorbed the past two months’ worsening inflation numbers by going exactly “nowhere.” Bond investors seem to be all-in on the Fed thesis that the inflation pickup is just transitory.
During the recent consolidation, however, the Treasury yield showed a subtle change in character—one that suggests there might be more inflation paranoia than meets the eye. The 10-year yield’s daily correlation with stock price movements flipped negative, and then plummeted toward a 21-year low.
Earnings’ Lost Relevance
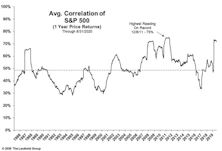
One characteristic of recent stock market action is extreme correlation. Chart 1 shows that during the sharp market decline following the COVID-19 arrival in the U.S. and the V-shaped upturn thereafter, the average correlation of S&P 500 constituents moved to near its highest level measured back to 1986.
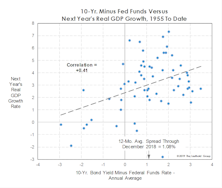
Stocks And GDP

Economists argue the best thing the stock market has going for it is the continuation of the U.S. economic expansion. Maybe.
“Too Smooth” Of A Ride?

While investors in Value, Small Caps, and especially foreign stocks might beg to disagree, a key MTI technical measure suggests this decade’s stock-market ride has been almost entirely “pain free.”
Correlations Are Worthless, Except This One
We’ve never understood investment quants’ desire to project correlations among assets. Such correlations are inherently unstable.
Yields Might Be Throwing A Curve
While the number of recession forecasts is on the rise, there’s a general reluctance among economists to project a downturn in the absence of a yield curve inversion.
Correlation "Cape"-r

During a stock market rally we find difficult to comprehend, it somehow seems appropriate to publish a chart we’re almost at a loss to explain. The first chart shows the 90-year history of the trailing one-year (252-day) correlation of daily returns across market sectors. Correlations have been in a free-fall of late, and now appear to have a good shot at undercutting the all-time low established midway through the 2000-2002 bear market.
The “Low Vol” Unwind: Just The Beginning?
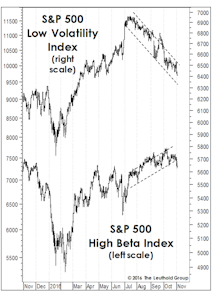
In mid-summer we suggested that attaining new market highs would probably require a rotation away from the long-time Low Volatility market leaders and into High Beta areas like Technology and industrial cyclicals.
Valuations: The Correction That Never Was
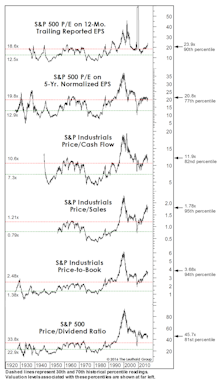
The correction failed to meaningfully “reset” any long-term valuation measures, hence, we don’t view the current environment as having much investment merit, but rather, primarily speculative appeal.
Correlation Breakdowns

We’d rather eat broken glass than have to forecast financial market correlations, but that doesn’t mean we ignore them altogether.
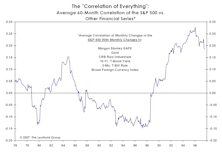
High Correlations And Their Meaning

While our tongue-in-cheek “Correlation Of Everything” measure has retreated from record levels, it remains far above anything seen prior to 2010.
Correlations Staying Steady

The decrease in correlations has been helpful for investors, but the lack of volatility in the measure has arguably been more important.
Sector Performance and Beta Comparisons

There are some substantial deviations in sector performance depending on your constituents and weighting scheme while, simultaneously, betas are converging toward one another.
Correlations And Factor Performance

Value factor performance took off at the end of June last year and never looked back; posting positive Q1 minus Q5 spreads every month since.
The Math Doesn’t Work For Long-Term Treasuries
The recent upside breakout in the U.S. 10-year yield was successful, and it appears interest rates will remain in the new higher range for now. But what are the short-term implications of higher U.S. Treasury rates on asset allocation decisions?
A Review Of Correlations & Factor Performance

A review of correlations and factor performance. Plus, weighting matters in sector performance as we compare the S&P 500 to our Leuthold 3000 universe.
The Role Of Commodities In A Multi-Asset Class Portfolio

The primary benefits are their inflation and U.S. dollar hedging capabilities.
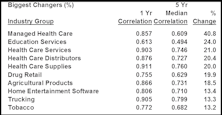
Correlations: Digging Deeper At The Sector & Group Levels

Correlations have been extremely elevated over the past few years when compared to historical levels. The question is, which parts of the market has this impacted the most?
The Changing Role of Gold In An Investment Portfolio

As global capital markets are yet again dominated by extreme macro-economic uncertainty, gold appears to be behaving as a hedge against extreme equity market movements, a store of value and an alternative to fiat currencies.
Stock/Bond Correlation Upside Down—Stocks And Interest Rates Can Rise In Tandem
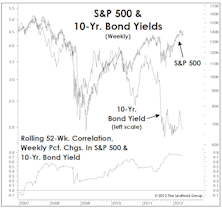
An examination of this historical relationship turns up some interesting findings that challenge the traditional disposition.
Correlations Steady After Sharp Drop
Correlations stabilized during March and remain below the record levels of last fall.
January Performance: Reversals Everywhere

January performance was nearly opposite that of 2011… Shifts in factor performance and volatility are discussed.
Factor Performance Remains Choppy

Factor performance continues to flip-flop, one-year correlations hit all-time high, Earnings Revisions remains the strongest factor in 2011, which prompts a deeper look.
The Return Of Value And Growth?

Correlations finally drop during the October market rally. Both Value and Growth factors outperformed during the month. Some momentum factors have diverged… each is an atypical occurrence.
Record Performance Correlations Continue
Industry groups and stocks continue to set records with performance correlations. Defensive groups have seen the largest percentage gain to current correlations relative to the last five years. There truly has been no place to hide in this market.
Correlations: Hitting Record Highs

Industry groups and stocks are now trading at record correlations.
Market Interrelationships: “Unlearning” What We Thought We Knew
Doug Ramsey examines several once very reliable relationships between stocks, bonds, inflation, and commodities.
Factor Performance: Insider Activity Finally Works; Value Continues To Struggle

Insider Activity measures finally additive in July after six months of negative results; other factors’ performance deteriorated, however.
Leuthold Stock Quality Rankings—Tracking Quality And Risk Cycles

High Quality Stocks outperformed their Low Quality comparators in the second quarter, and we find signs that a new High Quality Cycle is starting to take off.
Factor Performance Since 2009 Lows: Reversals Everywhere

Graphical representation of the difficulty since the March 2009 market bottom. Not many factors have been effective.
Correlations: Still At Peak Levels

Our calculations show the rise and fall of equity group correlations over time. How does this impact returns both historically and going forward?
The Charts Of The Year

This month’s “Of Special Interest” takes a look back at and updates some our favorite charts from 2010.
Back Aboard The Bull
Major Trend Index now Positive (both global and domestic). Even though we are bullish, there are several bullish arguments that we still don’t buy.
Mining An Over-Correlated Stock Market

Correlations between asset classes have been running quite high over the last couple of years. Eric Bjorgen looks at current tightly correlated sectors that historically have not been so correlated.
Market Correlation And Group Rotation Strategy

New data series confirms unprecedented correlations in equity markets.

Correlation In All The Wrong Places
Many quantitative factors, which had previously shown little correlation, suddenly all moved together.
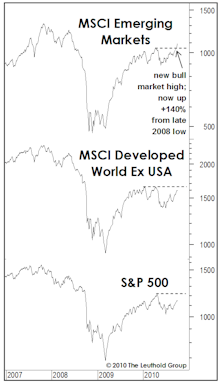
Is Your Portfolio "De-Worsified"?

This global bull market in stocks has been unusual in that it’s been accompanied by bull markets in things that often exhibit little correlation or even negative correlation to equities.
Perception for the Professional
March 2026 Issue

Featured Articles
Sector Navigator
April 2026 Issue
