CRB Raw Industrials
The Economy Rallied In January, Too
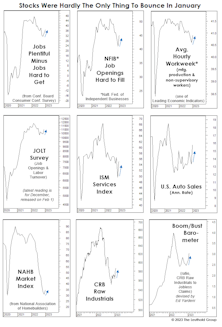
The narrative for January’s strong stock market bounce is that not all key economic releases looked to be forecasting a recession. However, one must consider that this was only true for coincident and lagging data series.
If Inflation Has Peaked, Thank The Stock Market—Not The Fed
.jpg?fit=fillmax&w=222&bg=FFFFFF)
High inflation continues to dominate the headlines, but it is only one piece of the “weight of the evidence” that’s stacked against the stock market. Still, in ironic fashion, stock-market action itself suggests that inflation is set to peak.
A Long Boom, And The Ultimate Bust
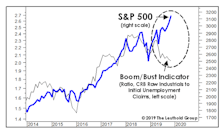
Last December, we marveled at the disconnect between the (surging) S&P 500 and the (sagging) Boom/Bust Indicator. Just six months later, we can only scratch our heads at what the hell we were complaining about.
Assessing The Commodity Free-Fall

For at least two years, the unofficial title of “the scariest chart in the Leuthold database” belonged to the S&P 500 Price/Sales ratio. That chart still rattles us, with the July month-end ratio still in the vicinity of its old Y2K high.
Icing Over?
.jpg?fit=fillmax&w=222&bg=FFFFFF)
Will this economic cycle end with “fire” (overheating) or “ice” (a whiff of deflation)? Interestingly, hedges against both outcomes have performed well in recent months, with both gold and Treasury bonds spiking. For many reasons, though, we believe the U.S. expansion is more likely to end in a deflationary bust.
Bust To Boom, And Back Again
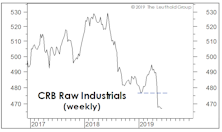
Last month, we observed that crude oil was the only item propping up broad-based commodity indexes, and that something was bound to give with the U.S. dollar pushing to new highs.
Non-Energy Commodities Signal A Major Slowdown
.jpg?fit=fillmax&w=222&bg=FFFFFF)
Late in the cycle, blue chip indexes like the DJIA and S&P 500 can fool investors by hiding subtler deterioration in the broad list of stocks. That’s been underway in the last couple of months, but it’s nothing in relation to the divergence that’s opened in the commodity market, where there’s an almost 20% YTD performance gap between the headline S&P/GS Commodity Index and its non-Energy components (Chart 1).
Perception for the Professional
March 2026 Issue

Featured Articles
Sector Navigator
March 2026 Issue
