Dow Jones Corporate Bond Index
The Trend Is A Bit Less Friendly
The MTI’s move to its Negative zone with the October 1st reading was driven by a few trend breakdowns—ones that could well reverse in short order. Recognizing the volatility of these signals (and perhaps having been “conditioned” by the one-way market of the last 18 months), we opted for just a minor asset allocation adjustment.
More On The “Rate-of-Change” In Rates…
The liquidity and interest-rate backdrop for stocks has been favorable to such an extreme that we’ve cautioned any minor diminution in this condition could trip up the stock market. On that score, the monetary aggregates and the Fed’s balance sheet don’t pose much concern. On the other hand...
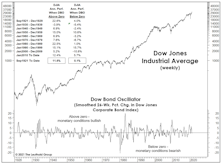
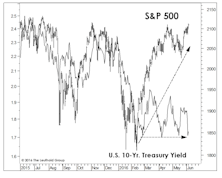
Rates: Does Trend Or Level Matter More?
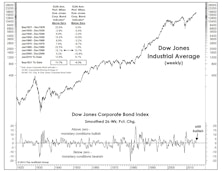
Our Dow Bond Oscillator (chart) issued what looks like an increasingly prescient SELL signal on January 26th.
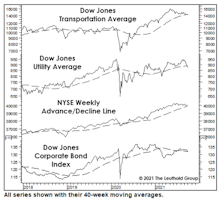
Temporary Power Outage?
With the northern U.S. stuck in a deep-freeze, there could hardly be a worse time for the nation’s utilities to fail. But conventional chart work suggests that is exactly what’s happened. The Dow Jones Utility Average fell below its 40-week moving average last Friday, dropping the simple four-indicator model, shown in the chart, into third gear after it had spent most of the year with “four on the floor.”
Need More Reasons To Buy?
When it rains, it pours. As if the market’s broad new highs of early June aren’t enough, here’s a pair of sub-models from the MTI’s Economic category that are set to turn bullish.
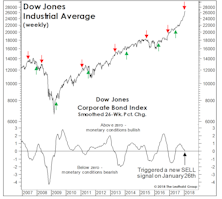
Are Bonds Doing Janet’s Job?
One of our most reliable stock market liquidity indicators decided not to wait for Janet Yellen to formally hike interest rates later this month.
What Is The Bond Market Telling Us?
We’re tactically bullish, but among the twelve “Charts That Worry Us” published in the April Green Book, we’ll concede there are a few that still worry us.
“Four On The Floor”
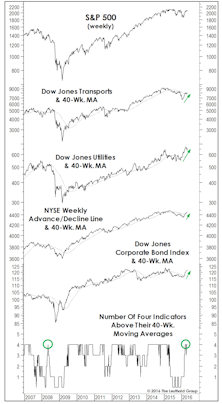
Leadership, breadth, and corporate credit all staged intermediate-term breakouts, rising above their respective 40-week moving averages. In this formation, historically, S&P 500 annualized return is +15%.
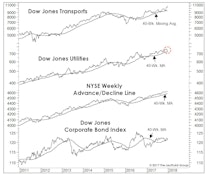
Improving Indicator Evidence
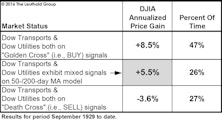
Last spring’s “Double Death Cross” in the Dow Transports and Dow Utilities had been partially reversed even before the February low, when the Dow Utilities’ 50-day moving average crossed above its 200-day moving average (thereby issuing a “Golden Cross”). The Dow Transports remain in a bear pattern based on the 50/200-day relationship, but the gap is closing fast.
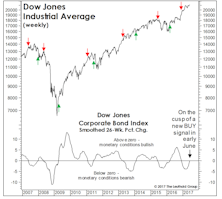
A Venerable Monetary Indicator Turned Negative
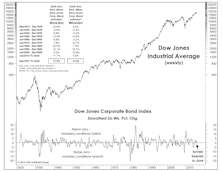
The smoothed, 26-week rate-of-change in the DJ Corporate Bond Index, a reliable indicator of monetary conditions over many different market and economic cycles, turned negative in mid-June.
Simple Monetary Gauge Still Bullish
Monetary conditions are critical to the stock market outlook, but it’s never been more difficult to measure those conditions. And it’s not just QE and ZIRP. Since 2013, one-fourth of the data series in the Fed’s valuable Bank Reserves repository has been discontinued. Beware of a central bank that declares itself “data dependent” and then does away with data involving its own machinations.
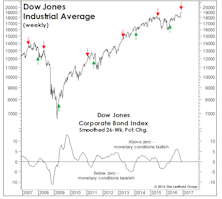
A Monetary Indicator That Still Works
The Dow Jones Corporate Bond Index has worked in eight of the last nine decades. The credit information in corporate bond prices provides valuable input for investors.
Perception for the Professional
March 2026 Issue

Featured Articles
Sector Navigator
March 2026 Issue
